Transcription of US AGRICULTURE FATALITY STATISTICS
1 US AGRICULTURE FATALITY STATISTICS . David W. Smith, Extension Safety Program The United States AGRICULTURE industry is essential to the livelihood of its citizens and the world. In 2002, the National Agricultural STATISTICS Service estimated more than million US farms that included 941 million acres in farm land and employed more than million workers. A majority of US farms employ less than 11 workers;. thus, they are exempt from Occupational Safety and Health Administration (OSHA) worker protection standards, worker training requirements, and accident reporting procedures. Given the high number of farm workers, lack of required safety education, and the inherent dangers involved in farm environments, a significant challenge exists in reducing the number of farm injuries and fatalities. The following discussion of agricultural industry fatalities (and farming occupation deaths, in particular) illustrates the need for effective worker safety programs.
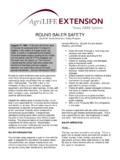
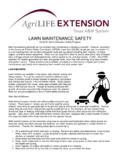
2 INDUSTRY AND OCCUPATION PERSPECTIVE Figure 1. Distribution of US Occupational Deaths for 1992 and 2002. Figure 1 gives the number of fatalities per major US 1200. AGRICULTURE Deaths: industry for 1992 and 2002. Data provided by the Number of Deaths 1000 779 in 1992. Bureau of Labor STATISTICS (BLS), Census of Fatal 789 in 2002. 800. Occupational Injuries (CFOI) ranks AGRICULTURE third in total number of deaths among all US occupations 600. behind only construction and transportation. The BLS 400. documents 789 and 730 deaths in the agricultural industry for 1992 and 2002, respectively, representing 200. a percent increase in the 10-year period. An 0. Const. Trans. Agri. Serv. Manuf. Govern. Trade Mining additional 150,000 workers suffered disabling injuries. 1992 2002 Industry Deaths are from BLS, CFOI. Deaths include persons of all ages. The death rate for agricultural workers remains high when compared to other US industries.
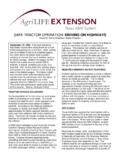
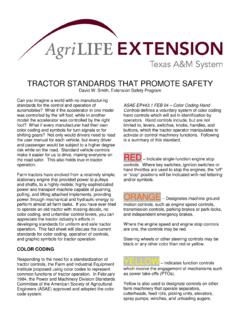
3 The AGRICULTURE industry is second only to mining in death Figure 2. Distribution of Occupational US. rate per 100,000 workers (Figure 2). National Safety Death Rates for 1992 and 2002. Council estimates based upon BLS employment data 30. list the AGRICULTURE death rate at deaths per 100,000 Workers 25 AGRICULTURE Death Rate: 100,000 workers and deaths per 100,000 workers Deaths per in 1992. in 1992 and 2002, respectively. This represents only a 20 in 2002. percent decrease in the 10-year period. 15. 10. United States Department of AGRICULTURE (USDA) data 5. for 2002 ranked the farming occupation second among 0. Const. Trans. Agri. Serv. Manuf. Govern. Trade Mining selected occupations with a FATALITY rate of 28 per 100,000 workers, behind only pilots and navigators Industry 1992 2002. ( ). Farming also rated second in total number of fatalities in 2002 at 519, behind only truck drivers Death rates based upon BLS, CFOI data and include persons 16 years or older.
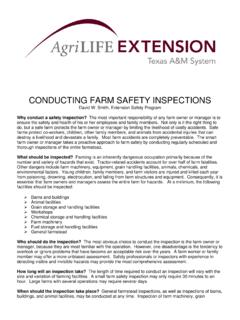
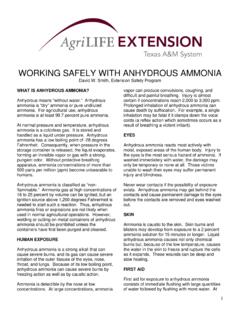
4 (808). The USDA defined farming to include non- horticultural farmers, non-horticultural farm managers, farm workers, and farm worker supervisors. NOTE: Death rate data only includes persons 16 years or older. These data do not account for accidental deaths to minors, who constitute a significant portion of the AGRICULTURE industry labor force. For example, a 1998. report released by the Department of Heath and Human Services indicated that more than 650,000 youth under the age of 16 worked on farms. In addition, an estimated 104 children per year under 20 years of age die of agricultural injuries on US farms. CAUSE OF DEATH Figure 3. Fatal Injuries by Industry and Event or Exposure, 2002. The very nature of agricultural work presents an Exposure to harmful Fires and assortment and frequency of hazards not realized in substance or explosions, 14, 2%. other occupations. Farmers and ranchers, for example, environment, 78, 10%.
5 Often must work in extreme environmental conditions while operating machinery and equipment that require Falls, 64, 8%. concentration and care to avoid serious injury. In addition, formalized worker training that includes Transportation incidents, 391, 49%. recognizing potential hazards, injury prevention, and emergency response is rare on farm operations. Given Contacts with these factors, the AGRICULTURE industry's second highest objects and equipment, 182, death rate among major US industry is not surprising. 23%. Source: USDA, BLS, CFOI 2002. Figure 3 illustrates the events or exposures leading to US Assaults or violent acts, 60, 8%. AGRICULTURE deaths in 2002. According to USDA data, 391. fatalities (or 49 percent of all agricultural injury deaths) were attributed to transportation incidents, involving highway, non-highway, air, water, and rail fatalities. Many fatalities are tractor related involving overturns. Twenty-three percent (or 182) of all fatalities occurred from contact with objects and equipment.
6 These involved crushing injuries, entanglements, and blunt force trauma from structures and AGRICULTURE implements. GENDER AND AGE. Overall employment figures show men with a slight majority (54 percent) compared to women workers (46 percent). However, data indicate than men are significantly more likely to experience accidental death (Figure 4). Gender difference is even more substantial within the AGRICULTURE industry. Though men comprised 74 percent of all workers age 16 years and older, 2001 BLS data show that men accounted for 96 percent of all fatalities. Age distribution in the AGRICULTURE industry, and farming Figure 4. Employment and FATALITY Profiles by occupation in particular, shows a significant number of Gender Across all Industries, 2002. youth (under 20) and seniors (over 65) are exposed to workplace and environmental hazards on a frequent Employment =. 137,700,000. Fatalities = 5,524. basis. A 1998 survey released in 2001 by the National Injury and Occupational Safety and Health (NIOSH).
7 Estimates that approximately million youth under the 8%. age of 20 years either work or live on farms. Of these, youth less than 10 years of age were estimated to have 46%. 54%. the highest number of injuries at approximately 11,000. and the highest work-related injury rate at 14 injuries per 92%. 1,000 workers. In addition, an estimated 104 children younger than 20 years of age die of agricultural injuries on US farms and ranches each year. Men Women Men Women Source: USDA, BLS, CFOI 2002. According to the BLS, there are more than 300,000. workers over the age of 65 employed in the AGRICULTURE industry. On farms, the effects of aging coupled with the inherent dangers involved in farm work and machinery can significantly increase risk of injury. The quick onset of fatigue, reduced vision, and slower reaction time associated with the normal aging process can seriously impact safe job performance. Nowhere is this more evident than in tractor operation.
8 NIOSH data has demonstrated that tractor drivers over 65 years of age may be two to three times as likely to die in tractor accidents as persons in other age groups. CONCLUSION. STATISTICS show that agricultural workers have been and continue to be exposed to numerous workplace hazards. Data also suggests that, given the large number and high injury/ FATALITY rates of children and elderly farm workers, future priority must be placed on youth safety and accident prevention. Farm safety researchers contend that communicating safety messages through venues that influence community leaders, such as through churches, banks, and other rural institutions, works better than safety education aimed directly at individual farmers who tune it out. Thus, using the influence of peer pressure provides an effective approach to change behaviors. All programs and information of The Texas AgriLife Extension Service are available to everyone without regard to race, color, religion, sex, age, handicap or national origin.