Transcription of USDA SUPPLY & DEMAND REVIEW July 12, 2018
1 USDA SUPPLY & DEMAND REVIEW July 12, 2018 **This report includes information from sources believed to be reliable and accurate as of the date of this publication, but no independent verification has been made and we do not guarantee its accuracy or completeness. Opinions expressed are subject to change without notice. This report should not be construed as a request to engage in any transaction involving the purchase or sale of a futures contract and/or commodity option thereon. The risk of loss in trading futures contracts or commodity options can be substantial, and investors should carefully consider the inherent risks of such an investment in light of their financial condition.
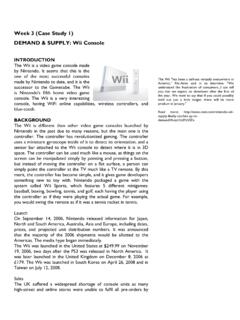
2 SOYBEANS SOYBEANS: The July USDA SUPPLY DEMAND report was considered bearish with 2018-19 US ending stocks coming in at 580 million bushels versus the average estimate of 471 million bushels (390-571 range) and compared to last month's 385 million bushels. This would be a record high. The 2017-18 US ending stocks came in at 465 million bushels versus the average estimate of 507 million bushels (478-631 range) and compared to last month's 505 million. The soybean yield came in at bushels per acre versus the average estimate of bushels/acre ( range) and compared to in June.
3 Soybean production came in at billion bushels versus the average estimate of billion bushels. The July 2018/19 World ending stocks came in at million tonnes versus the average estimate of ( range) million tonnes and compared to million in June. The 2017/18 World ending stocks came in at million tonnes versus the average estimate of million tonnes and compared to million last month. The Argentine soybean production is estimated at 37 million tonnes versus the average estimate of million tonnes ( range) and compared to last month's million.
4 Brazil's soybean production came in at million tonnes versus the average estimate of million tonnes and compared to last month's million. PRICE OUTLOOK: Both US and world ending stocks are higher than expected and "if" we adjust yield higher for the August production report, US ending stocks could increase again. The USDA lowered China import DEMAND to 95 million tonnes from 103 million last month. Keep 836 as next downside target for November soybeans and then 820. If the market can close higher today, the key reversal might be seen as supportive.
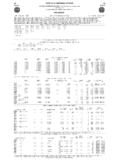
5 USDA SUPPLY /DEMANDUS SOYBEANSJul Jul Jun JulUSDA USDA USDA USDA16-17 17-18 18-19 18-19 Area (M Acres) (Bu/Acre) Stocks (M Bu)197 302 505 465 Production4,296 4,392 4,280 4,310 Imports22 25 25 25 SUPPLY ,Total4,515 4,715 4,810 4,800 Crushings1,901 2,030 2,000 2,045 Exports2,166 2,085 2,290 2,040 Seed105 104 103 103 Residual41 32 32 32 Use, Total4,214 4,251 4,425 4,220 Ending Stocks302 465 385 580 Stocks/Use USDA SUPPLY /DEMANDJulJulJunJulWORLD SOYBEANSUSDA USDA USDA USDA(Million Metric Tons)
6 16-17 17-18 18-19 18-19 SUPPLY Beginning Crush, Total USDA SUPPLY & DEMAND REVIEW July 12, 2018 **This report includes information from sources believed to be reliable and accurate as of the date of this publication, but no independent verification has been made and we do not guarantee its accuracy or completeness. Opinions expressed are subject to change without notice. This report should not be construed as a request to engage in any transaction involving the purchase or sale of a futures contract and/or commodity option thereon.
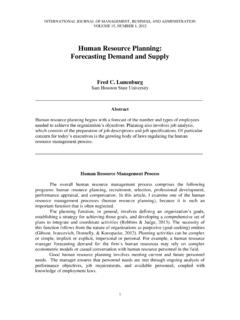
7 The risk of loss in trading futures contracts or commodity options can be substantial, and investors should carefully consider the inherent risks of such an investment in light of their financial condition. CORN CORN: The July USDA SUPPLY / DEMAND report for corn was considered bullish with 2018-19 US ending stocks coming in at billion bushels versus the average estimate of billion bushels ( range) and compared to last month's billion bushels. The 2017-18 US ending stocks came in at billion bushels versus the average estimate of billion bushels ( range) and compared to last month's billion bushels.
8 The average yield came in at 174 bushels per acre versus the average estimate of bushels/acre ( range) and compared with the June estimate of 174 bushels/acre. Corn production came in at billion bushels versus the average estimate of billion bushels. The July 2018/19 World ending stocks came in at million tonnes versus the average estimate of million tonnes ( range) and compared to last month's million. The 2017/18 World ending stocks came in at million tonnes versus the average estimate of million tonnes ( range) and compared to last month's million.
9 Argentina's corn production came in at 33 million tonnes versus the average estimate of million tonnes and compared to last month's million. Brazil's corn production came in at million tonnes versus the average estimate of million tonnes and compared to last month's million tonnes. PRICE OUTLOOK: The report news is bullish and a higher close today will represent a key reversal with an outside-day up. World stocks/usage ratio is at the lowest level since the 1973/74 season. Traders will assume a much higher yield for August. Resistance for December corn is 369 and 379, with support at 355.
10 USDA SUPPLY /DEMANDUS CORNJul Jul Jun JulUSDA USDA USDA USDA16-17 17-18 18-19 18-19 Area (M Acres) (Bu/Acre) Stocks (M Bu)1,737 2,293 2,102 2,027 Production15,148 14,604 14,040 14,230 Imports57405050 SUPPLY , Total16,942 16,937 16,192 16,307 Feed & Residual5,470 5,450 5,350 5,425 Food, Seed & Industry6,885 7,060 7,165 7,105 Ethanol for Fuel5,432 5,600 5,675 5,625 Domestic Total12,355 12,510 12,515 12,530 Total Exports2,294 2,400 2,100 2,225 Use, Total14,649 14,910 14,615 14,755 Ending Stocks2,293 2,027 1,577 1,552 Stocks/Use USDA SUPPLY /DEMANDJulJulJunJulWORLD CORNUSDA USDA USDA USDA(Million Metric Tons)