Transcription of Using i-Ready Diagnostic scores to meet the Learning ...
1 Curriculum Associates i-Ready Diagnostic is an award-winning computer delivered, adaptive assessment in Reading and Mathematics for students in kindergarten through high school. The assessment is built on the College and Career Readiness Standards and tied to online instructional modules ( , i-Ready Instruction). The i-Ready Diagnostic provides the data-driven insights that classroom teachers and school and district administrators need to determine exactly where to focus their instructional time to ensure all students are on track to meet these more rigorous expectations. The i-Ready Diagnostic was developed to serve several purposes: Establish a metric that will allow for an accurate assessment of student knowledge that can be monitored over a period of time to gauge student improvement Accurately assess student knowledge for different content strands within each subject Provide information on what skills students are likely to have mastered and likely need to work on next Link the assessment results to instructional advice and student placement decisions About This GuideTo aid districts in Using i-Ready to meet the data reporting requirements of the LAP program, we have prepared the following guide to Using the data generated by the i-Ready Diagnostic to support LAP, and in particular, to determine the following required data points for reporting to the state s Comprehensive Education Data and Research System (CEDARS).
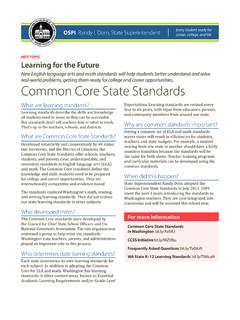
2 Beginning score Date of beginning score End score Date of end score Amount of academic growth (reported as months of growth) Using i-Ready Diagnostic scores to meet the Learning Assistance Program (LAP) data reporting guidelines for the Office of the Superintendent of Public Instruction (OSPI)2 Exhibit 1: Student Diagnostic Growth ReportIn this example, Danielle Baker is a fifth grade student who completed her first Diagnostic on 9/14/18 and had a beginning score of 459. Her 459 score corresponds to a grade-level placement of 1 Grade Level Below her chronological grade (placing her in Grade 4). Danielle completed her third Diagnostic on 03/15/2019 and had an end score of Date of Beginning Score2 Beginning Score3 Grade-Level Placement4 Date of End Score5 End ScoreOverall Diagnostic GrowthPlacement by DomainYear-to-Date GrowthProgress to Annual Typical GrowthProgress to Annual Stretch Growth KeyOverallNumber and OperationsAlgebra and Algebraic ThinkingMeasurement and DataGeometry Grade 4 Grade 4 Grade 4 Grade 4 Grade 3 Grade 4 Grade 4 Grade 4 Early 5 Grade 3 Early 5 Mid 5 Early 5 Early 5 Grade 4 Diagnostic 1 Diagnostic 2 Diagnostic 3 Typical 477 Stretch 490 410 530 +17+29 PDFD iagnostic GrowthDanielle BakerGrade 5 Diagnostic 3 488 Early 503/15/19 Diagnostic 1459 Grade 409/14/18 Diagnostic 2476 Grade 412/14/18 Scale Points: 29/18 Scale Points: 29/31 This student has made 161% progress toward annual typical growth.
3 Typical growth is the average growth of students at this grade and placement student has made 94% progress toward his or her stretch growth. Stretch growth is an ambitious but attainable level of annual growththat puts students on a path toward proficiency. This student will need to meet his or her annual stretch growth for at least 1 year to be proficient. Proficient for fifth grade is a mid on-grade level scale score of Improved from InitialSubjectMathPlacement DefinitionEnd-of-Year View50%100%161%50%100%94%On Grade Level (480-540) Learn More about GrowthHelpAssess & TeachRostersRegina MooreReports214353 Determining Amount of Academic GrowthThe i-Ready Diagnostic is reported Using a vertical scale that allows for comparing growth within and across years. Students receive a scale score each time they take the Diagnostic assessment. The difference between these scale scores represents their growth along a continuum. When administered three times per year over regular intervals (12 18 weeks between Diagnostics), the scale scores provide a valid measure of how much growth a student has achieved.
4 Every student has their own unique growth trajectory and we do not expect students to have constant movement across the 10 months. To determine the amount of Academic Growth in terms of months of growth, three pieces of information are required:1. Student s initial overall placement level 2. Student s differentiated Typical Growth measure3. Student s scale score changeThe student s initial overall placement level can be determined after the first Diagnostic administration. This information can be found on the Student Diagnostic Results report (see Exhibit 1). To select the student s differentiated Typical Growth measure, use Table 1: Annual Growth Measures Reading or Table 2: Annual Growth Measures Mathematics as appropriate to determine the annual growth measure for a student based upon his/her grade, subject, and relative placement Typical Growth measures listed in Table 1 and 2 represent the observed median growth of students at the different relative placement levels over a period of 30 weeks of instruction.
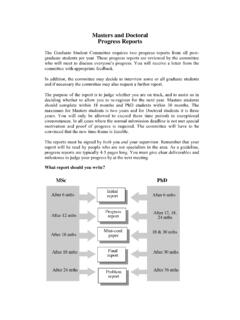
5 Using these tables, the Typical Growth measure for Mathematics for a student in the fifth grade with a relative placement of 1 Grade Level Below ( , Grade 4 overall placement) is 18 scale score 2: Typical Growth Measures MathematicsTable 1: Typical Growth Measures ReadingGrade3 or More Grade Levels Below2 Grade Levels Below1 Grade Level BelowEarly On Grade LevelMid On Grade Level or AboveKNANA4944431NA544947372NA4439292233 6332622174282320171252620161376191412947 1712106481812944 Grade3 or More Grade Levels Below2 Grade Levels Below1 Grade Level BelowEarly On Grade LevelMid On Grade Level or AboveKNANA3224211NA362926212NA2926221833 0272625214242323231952018181814615141413 1371313121211812109994 The student s scale score change can be calculated by finding the student s beginning score and subtracting it from the student s end score. Any negative scores should be translated to 0 as this is highly likely due to measurement error rather than students truly losing skills or regressing.
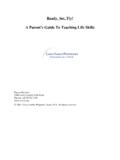
6 Note: The student scale score change is the observed growth of a student and the true growth may differ by approximately +/- scale score points per month. Calculation WorksheetStep 1: Calculate the expected growth per 2: Calculate the months of CalculationDanielle is a fifth grade student in the LAP program for Mathematics intervention. Based upon her initial Diagnostic , she has a beginning scale score of 463, and therefore has an overall placement of Grade 4. Because she is currently in Grade 5 but has an overall placement of Grade 4, her relative placement is 1 Grade Level below her current grade. Her most recent Diagnostic (third administration) completed at the end of the school year shows her end scale score as Table 2: Typical Growth Measures Mathematics, we see her Differentiated Growth Measure is 18 scale score a result, her Expected Growth per month = 18 scale score points across 10 months, or scale score points per all calculated Months of Growth, round the months to the nearest integer prior to entry into CEDARS.
7 Expected Growth Per Month =Student's Differentiated Typical Growth Measure10 (months)Months of Growth =Student s Scale Score ChangeExpected Growth per MonthMonths of Growth ===492 463 (End score Beginning score) scale score points per Months of Growth