Transcription of Using R for Data Analysis and Graphics Introduction, Code ...
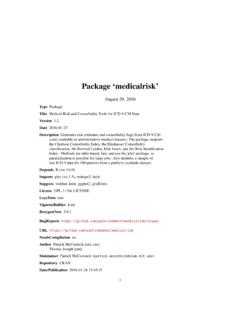
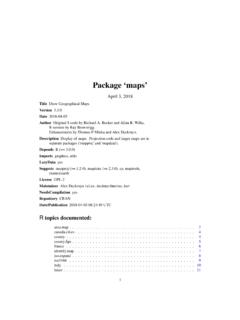
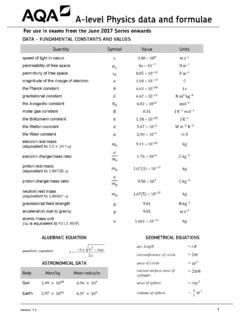
1 Using R for data Analysis and Graphics Introduction, Code and Commentary J H Maindonald Centre for Mathematics and Its Applications, Australian National University. J. H. Maindonald 2000, 2004, 2008. A licence is granted for personal study and classroom use. Redistribution in any other form is prohibited. Languages shape the way we think, and determine what we can think about (Benjamin Whorf.). This latest revision has corrected several errors. I plan, in due course, to post a new document that will largely replace this now somewhat dated document, taking more adequate account of recent changes and enhancements to the R system and its associated packages since 2002. 19 January 2008 ii ii taillength6065707532343638404260657075fo otlength323640ear conchlength4045505540455055 CambarvilleBellbirdWhian WhianByrangeryConondaleAllyn RiverBulburinfemalemale Lindenmayer, D. B., Viggers, K. L., Cunningham, R. B., and Donnelly, C. F. : Morphological variation among populations of the mountain brushtail possum, trichosurus caninus Ogibly (Phalangeridae:Marsupialia).
2 Australian Journal of Zoology 43: 449-459, 1995. possum n. 1 Any of many chiefly herbivorous, long-tailed, tree-dwelling, mainly Australian marsupials, some of which are gliding animals ( brush-tailed possum, flying possum). 2 a mildly scornful term for a person. 3 an affectionate mode of address. From the Australian Oxford Paperback Dictionary, 2nd ed, 1996. The R The Look and Feel of The Use of these The R Web Pages and Email Datasets that relate to these 1. Starting Getting started under Use of an Editor Script A Short R Entry of data at the Command Entry and/or editing of data in an editor Options for ()..6 Options for plot() and allied Further Notational On-line The Loading or Attaching of 2. An Overview of The Uses of R may be used as a R will provide numerical or graphical summaries of R has extensive graphical R will handle a variety of specific R is an Interactive Programming R * More on Joining (concatenating) Subsets of The Use of NA in Vector data data frames as Inclusion of character string vectors in data Built-in data iv iv Common Useful Applying a function to all columns of a data Making Numbers of NAs in subgroups of the The Search Functions in An Approximate Miles to Kilometers A Plotting More Detailed 3.
3 Plot () and allied Plot methods for other classes of Fine control Parameter Multiple plots on the one The shape of the graph Adding points, lines and Size, colour and choice of plotting Adding Text in the Identification and Location on the Figure identify()..24 locator()..25 Plots that show the distribution of data Histograms and density Normal probability Other Useful Plotting Scatterplot Adding lines to Scatterplot Plotting Mathematical Guidelines for 4. Lattice Examples that Present Panels of Scatterplots Using xyplot()..31 Some further examples of lattice Plotting columns in v v Fixed, sliced and free An incomplete list of lattice 5. Linear (Multiple Regression) Models and Analysis of The Model Formula in Straight Line Regression Model Formulae, and the X Model Formulae in * Manipulating Model Multiple Linear Regression The data frame Weights of Polynomial and Spline Polynomial Terms in Linear What order of polynomial?
4 42 Pointwise confidence bounds for the fitted Spline Terms in Linear Using Factors in R The Model * Other Choices of Multiple Lines Different Regression Lines for Different aov models ( Analysis of Variance)..47 Plant Growth * Shading of Kiwifruit 6. Multivariate and Tree-based Multivariate EDA, and Principal Components Cluster Discriminant Decision Tree models (Tree-based models)..53 *7. R data Subsets of Patterned Missing data Extraction of Component Parts of data vi vi data Sets that Accompany R data Entry Missing values when Using ()..57 Separators when Using ()..57 Factors and Ordered Ordered * Matrices and Conversion of Numeric data frames into 8. Functions for Confidence Intervals and The t-test and associated confidence Chi-Square tests for two-way Matching and String * Operations with Vectors of Text Strings A Further Application of a Function to the Columns of an Array or data apply().
5 63 sapply()..63 * aggregate() and tapply()..63 * Merging data Writing Functions and other Syntax and A Function that gives data Frame Compare Working Directory data Sets with a Reference Issues for the Writing and Use of Functions as aids to data A Simulation Poisson Random *9. GLM, and General Non-linear A Taxonomy of Extensions to the Linear Logistic Anesthetic Depth glm models (Generalized Linear Regression Modelling)..74 vii vii data in the form of The gaussian Models that Include Smooth Spline Dewpoint Survival Non-linear Model Further *10. Multi-level Models, Repeated Measures and Time Multi-Level Models, Including Repeated Measures The Kiwifruit Shading data , The Tinting of Car The Michelson Speed of Light Time Series *11. Advanced Programming Extracting Arguments to Parsing and Evaluation of Plotting a mathematical Searching R functions for a specified 12.
6 Appendix R Packages for Contributed Documents and Published data Sets Referred to in these Answers to Selected Section Section Section Section viii viii 1 Introduction These notes are designed to allow individuals who have a basic grounding in statistical methodology to work through examples that demonstrate the use of R for a range of types of data manipulation, graphical presentation and statistical Analysis . Books that provide a more extended commentary on the methods illustrated in these examples include Maindonald and Braun (2003). The R System R implements a dialect of the S language that was developed at AT&T Bell Laboratories by Rick Becker, John Chambers and Allan Wilks. Versions of R are available, at no cost, for 32-bit versions of Microsoft Windows for Linux, for Unix and for Macintosh OS X. (There are are older versions of R that support and 9.) It is available through the Comprehensive R Archive Network (CRAN). Web addresses are given below.
7 The citation for John Chambers 1998 Association for Computing Machinery Software award stated that S has forever altered how people analyze, visualize and manipulate data . The R project enlarges on the ideas and insights that generated the S language. Here are points that potential users might note: R has extensive and powerful Graphics abilities, that are tightly linked with its analytic abilities. The R system is developing rapidly. New features and abilities appear every few months. Simple calculations and analyses can be handled straightforwardly. Chapters 1 and 2 indicate the range of abilities that are immediately available to novice users. If simple methods prove inadequate, there can be recourse to the huge range of more advanced abilities that R offers. Adaptation of available abilities allows even greater flexibility. The R community is widely drawn, from application area specialists as well as statistical specialists. It is a community that is sensitive to the potential for misuse of statistical techniques and suspicious of what might appear to be mindless use.
8 Expect scepticism of the use of models that are not susceptible to some minimal form of data -based validation. Because R is free, users have no right to expect attention, on the R-help list or elsewhere, to queries. Be grateful for whatever help is given. Users who want a point and click interface should investigate the R Commander (Rcmdr package) interface. While R is as reliable as any statistical software that is available, and exposed to higher standards of scrutiny than most other systems, there are traps that call for special care. Some of the model fitting routines are leading edge, with a limited tradition of experience of the limitations and pitfalls. Whatever the statistical system, and especially when there is some element of complication, check each step with care. The skills needed for the computing are not on their own enough. Neither R nor any other statistical system will give the statistical expertise needed to use sophisticated abilities, or to know when na ve methods are inadequate.
9 Anyone with a contrary view may care to consider whether a butcher s meat-cleaving skills are likely to be adequate for effective animal (or maybe human!) surgery. Experience with the use of R is however, more than with most systems, likely to be an educational experience. Hurrah for the R development team! The Look and Feel of R R is a functional There is a language core that uses standard forms of algebraic notation, allowing the calculations such as 2+3, or 3^11. Beyond this, most computation is handled Using functions. The action of quitting from an R session uses the function call q(). It is often possible and desirable to operate on objects vectors, arrays, lists and so on as a whole. This largely avoids the need for explicit loops, leading to clearer code. Section has an example. 1 The structure of an R program has similarities with programs that are written in C or in its successors C++ and Java.
10 Important differences are that R has no header files, most declarations are implicit, there are no pointers, and vectors of text strings can be defined and manipulated directly. The implementation of R uses a computing model that is based on the Scheme dialect of the LISP language. 2 The Use of these Notes The notes are designed so that users can run the examples in the script files ( , , etc.) Using the notes as commentary. Under Windows an alternative to typing the commands at the console is, as demonstrated in Section , to open a display file window and transfer the commands across from the that window. Readers of these notes may find it helpful to have available for reference the document: An Introduction to R , written by the R Development Core Team, supplied with R distributions and available from CRAN sites. The R Project The initial version of R was developed by Ross Ihaka and Robert Gentleman, both from the University of Auckland. Development of R is now overseen by a `core team of about a dozen people, widely drawn from different institutions worldwide.