Transcription of USING STATISTICS TO SCHEDULE MAINTENANCE
1 USING STATISTICS TO SCHEDULE MAINTENANCEC opyright 1999 Engineered Software, scheduling does not have to be based on "expert opinion". By carefully recording failure data, or usingfailure data from manufacturers, MAINTENANCE schedules can be economically optimized USING statistical types of MAINTENANCE will be considered1) Preventive MAINTENANCE ,2) Inspections, and3) Predictive maintenancePreventive MAINTENANCE is the standard "PM". A PM is performed to prevent failures due to wear. Examples arechanging hoses, changing belts, routine cleaning, etc. Inspections are used to reduce the impact of failures that are notcatastrophic. Consider the human body. A cancer inspection has a cost (money, time, pain and embarrassment), butthe damage created by the cancer increases with time if not treated (the cost of a failure is proportional to time).
2 Predictive MAINTENANCE is used to prevent failures by detecting some type of warning, such as, increased vibration,increased particle count in oil, or increased VERSUS COMPLETE DATAIf ten items are tested until all ten fail, this is a complete data set. If the test is ended before all ten items fail, the itemsthat did not fail are "censored."Consider the data in the table below. Eight items were placed on test stands; three of the items failed, and five of theitems were removed from testing without of Censored Data3060 +4060 +5060 +60 +60 +Obviously, the sample average and the sample standard deviation for the three failed items cannot be used to estimatethe parameters of the normal distribution in this case. The sample average is (30+40+50)/3 = 40.
3 The time to fail foreach of the remaining five items is greater than 60; the true average is considerably greater than data in the table above are right censored. An item is censored on the right if the failure time is not known, but itis known that the item survived to a known time without failure. If an item is known to be in a failed condition at aspecific time, but the exact failure time is not known, this is left censoringSingle censoring occurs when there is only one censoring point. If 100 transistors are placed on test stands and the testis terminated after 1000 hours, there is a single censoring point at 1000 hours. If 20 transistors were removed withoutfailure after 1000 hours of testing and another 15 transistors were removed without failure after 1200 hours of testing,there are two censoring points, and the resulting data are multiply censored.
4 If exact failure times are not known, butthe numbers of failures in a time interval are recorded, this is interval or grouped WEIBULL DISTRIBUTIONThe Weibull distribution is a continuous distribution that was publicized by Waloddi Weibull in initially met with skepticism, it has become widely used, especially in the reliability field. The Weibulldistribution's popularity resulted from its ability to be used with small sample sizes and its flexibility. In addition to2being the most useful density function for reliability calculations, analysis of the Weibull distribution provides theinformation needed for troubleshooting, classifying failure types, scheduling preventive MAINTENANCE and schedulinginspections. The Weibull probability density function is()fxxx()exp= 1 , x 0(1)where = the shape parameter, = the scale parameter, and = the location , and are continuous.
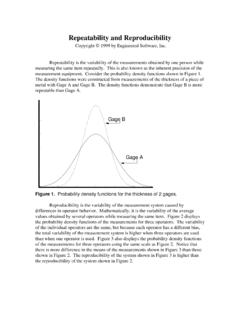
5 The acceptable ranges for these variables are0 < < ,0 < < , and- < < .The estimation of these parameters is not straightforward, and special techniques such as probability plotting, hazardplotting, or maximum likelihood estimation are OF THE SHAPE PARAMETERBy altering the shape parameter, , the Weibull probability density function takes a variety of shapes. This isdemonstrated in Figure Xf(x) = =1 =2 = =91/ Figure 1. Weibull probability density that several of the probability density functions displayed in Figure 1 look familiar. The Weibull distribution canbe used in a wide variety of situations and dependent on the value of , is equal to or can approximate several otherdistributions. For example, if = 1, the Weibull distribution is identical to the exponential distribution, = 2, the Weibull distribution is identical to the Rayleigh distribution, = , the Weibull distribution approximates the lognormal distribution, = , the Weibull distribution approximates the normal distribution.
6 And = 5, the Weibull distribution approximates the peaked normal of this flexibility, there are few observed failure rates that cannot be accurately modeled by the Weibulldistribution. Some specific cases are the breaking strength of components or the stress required to fatigue metals, the time to fail for electronic components, the time to fail for items that wear out, such as automobile tires, and systems that fail when the weakest component in the system OF PARAMETER ESTIMATIONThe four most widely used methods of parameter estimation are:1) Maximum Likelihood Estimation,2) Moment Estimation,3) Probability Plotting, and4) Hazard LIKELIHOOD ESTIMATIONM aximum likelihood is the most widely used method for generating estimators. It is based on the principle ofdetermining the parameter(s) value(s) that maximize(s) the probability of obtaining the sample likelihood function for a given distribution is a representation of the probability that the sample data of obtainingthe sample values.
7 Let xxxn12, ,.., be independent, random variables from the probability density function fx(, ) ,where is the single distribution parameter. ThenLx xxfxfxfxnn( , ,.., ; )( , ) ( , ).. ( , )1212 =is the joint distribution of the random variables, or the likelihood function. The maximum likelihood estimate, ,maximizes the likelihood function. This estimate is asymptotically normal. Often the natural logarithm of thelikelihood function is maximized to simplify ESTIMATIONM oment estimation is based on the concept of matching the moments of the sample data with the moments defined bythe distribution of interest and its parameters. For example, when estimating the parameters of the two parameterWeibull distribution, the first and second moments from the sample data, the sample mean and the sample variance,would be equated to the expressions =+ 11 and4 2221111=+ + PROBABILITY PLOTTINGP robability plotting is a graphical method of parameter estimation.
8 The cumulative distribution function is linearized,usually by a logarithmic transformation, and plotted. The slope and the intercept of the plot provide the informationneeded to estimate the parameters of the distribution of interest. The median rank is used to estimate the cumulativedistribution function, and ranks at user input levels are used to provide confidence intervals for reliability. If manuallyconstructing a probability plot, distribution specific hazard paper is required. By USING probability paper, the failuretimes and cumulative distribution function estimates can be plotted directly. With the power of personal computers,specialized graph paper is no longer needed, as the necessary transformations can be made quickly and PLOTTINGH azard plotting is a graphical method of parameter estimation.
9 The cumulative hazard function is linearized, usuallyby a logarithmic transformation, and plotted. The slope and the intercept of the plot provide the information needed toestimate the parameters of the distribution of interest. If manually constructing a hazard plot, distribution specifichazard paper is required. By USING hazard paper, the failure times and cumulative hazard function estimates can beplotted directly. With the power of personal computers, specialized graph paper is no longer needed, as the necessarytransformations can be made quickly and MAINTENANCEIn some cases, it is possible to prevent failures with preventive MAINTENANCE . The question is to determine if preventivemaintenance is applicable, and if so, how often should it be scheduled.
10 Referring to Figure 2, failures can be groupedinto 3 categories based on the behavior of the failure rate. Infant mortality failures are characterized by a decreasingfailure rate. The hazard function (failure rate) of the Weibull distribution is decreasing if the shape parameter, , isless than Random failures exhibit a constant failure rate; the shape parameter of the Weibull distribution is equalto Wear-out failures have an increasing failure rate; the shape parameter of the Weibull distribution is greaterthan < 1 = 1 >1 REGION IREGION IIREGION IIIF igure 2. The bathtub mortality failures are premature failures that can often be prevented by management. If infant mortality failurescannot be prevented, a burn-in procedure can be implemented to eliminate failures before the product is MAINTENANCE is not applicable for an item with a decreasing failure rate.