Transcription of USP Dissolution Test with Pooled Samples Statistical ...
1 USP Dissolution Test with Pooled Samples Statistical Analysis of the Third Stage Nora S. Meneces1, Carlos D. Saccone1,2 and Julio Tessore1. email: Abstract Dissolution test as defined by USP is an important determination in assessing the quality of different pharmaceutical forms. Some years ago, the Pooled Samples test was introduced. This test is carried out in three stages like the test for indi- vidual Samples , but it uses different acceptance criteria. Some doubts have been raised regarding calculation of the third stage average. In this paper, the Statistical precision of an equation for this calculation is discussed.
2 Average Dissolution val- ues used to assess compliance are affected by several sources of variability: measurement, dissolved amount unit to unit differences, etc. These sources of variability were studied and preferred zones are described for different values of those components, to calculate third stage averages. The results obtained were verified with a simulation study. It was demon- strated that it is possible to reduce the number of units tested in the third stage without introducing a noticeable increase of the risks in the acceptance/rejection decisions.
3 Introduction Product variability: variability between units of the prod- I. n the third stage of the USP Dissolution Test with Pooled uct refers to the dissolved amount in the Dissolution test Samples (1),(criteria shown in Table 1),the average value ( variability of the concentration of analyte present in of the lot submitted to inspection is compared with the the vessel at the end of the Dissolution test). This compo- value of the parameter Q specified in the monograph. When nent was described using the RSD (relative standard the third stage is reached,the calculation of the average of deviation).
4 A RSD range of 1-10% covering the usual val- the 3 values obtained in the three stages,can originate the ues (2) was studied. question if the value of the third stage must be weighted Variability (or uncertainty) due to measurements, includ- double taking in account the fact that they are twelve units ing: instead of six. The following aspects are investigated in this Variability of aliquot volumes used to make the Pooled paper: sample. This variability has been modeled using CVp (coefficient of variation of volume delivered); its usual a. Which is the best estimate of the mean value (weighted value was considered to be (1%).)
5 Vs. non-weighted estimations), Variability related to the operation of adjusting Pooled b. Which are the consequences of applying an expression volume. This variability has been modeled using CVe that differs from the optimum for estimation of the (coefficient of variation of the filling of the volumetric mean, flask); its usual value was considered to be c. Which would be the consequences of taking a sample ( ). of only six units also in the third stage instead of twelve. Variability related to the measurement of the concen- tration of the analyte in the Pooled solution.
6 This has Discussion been modeled using CVa (coefficient of variation of To perform this work a Statistical model of the inspection analysis); figures taken were between and has been built,including the following sources of variability ( ) in order to consider the different analytical in the results of each stage: procedures that might be used. Performing the usual approximation, where: any and any , variability of results of each stage is obtained: (1). 1 University of the Republic of Uruguay, Faculty of Engineering, Industrial 2 Correspondingauthor, Facultad de Ingenier a, Instituto de Ingenier a Production Department, Montevideo, Uruguay Mec nica y Producci n Industrial, Julio Herrera y Reissig 565, Montevideo, Uruguay 18 Dissolution Technologies | AUGUST 2005.
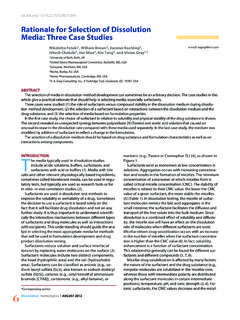
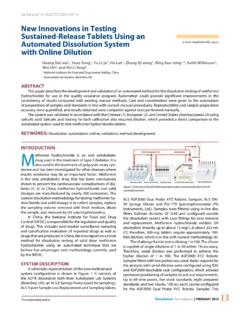
7 Figure 1. Differences [CV 2m (w = 1/4) CV2m (w = 1/3)] % as a function of CVa for different RSD. (2). Where: R1, R2, R3 are the Pooled results obtained in stage 1, 2 and 3. CVR1 is coefficient of variation of result in stage 1, CVR2 is assumed to be the same as CVR1. CVR3 is coefficient of variation of result in stage 3, and RSD is expressed as a percentage. with the results of stages 1, 2 and 3, the mean value of the lot is estimated (m) and the decision of acceptance or rejection is taken by comparing this value with Q. The method established by USP gives equal weights to the three results despite the fact that they have been obtained with different numbers of dosage units.
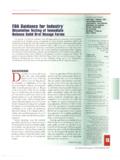
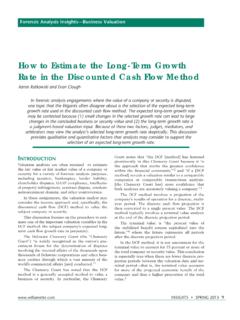
8 Figure 2. Weighting factors preferred zones (CVp = and CVe = ). In a general way, weighting of the results can be expressed as follows: The partial derivative of equation 4 with respect to w is: (3). In this equation the following considerations have been (5). assumed: Then it can be obtained the value of w, which makes Same weighting is given to results 1 and 2 because they minimum the variability of the calculated average value m, have similar variability, and therefore the most efficient estimator of the mean (3). Result for stage 3 is weighted by a factor (1-2w), which The expression is as follows: assures that the three factors add to 1 and m is an aver- age of the results obtained.
9 (6). The variability of the calculated mean value (m) is given by: A value of w = 1/3, indicates that the best estimation is (4) obtained giving to the three results the same weighting, Dissolution Technologies | AUGUST 2005. 19. while a value of w = 1/4 indicates that in order to obtain minimum variability in m (estimation of mean lot value), double weighting must be given to the stage 3 result. In order to quantify the results, w has been studied as a function of the analytical parameters and the variability of the lot expressed as RSD. Data are shown in Table 2.
10 Values obtained show that: There is not a unique optimum value of w in the range of parameters considered, When the variability of m is dominated by measurement (low RSD, high CVa) the optimum w value approaches 1/3, but when product variability dominates (high RSD, low CVa), optimum value of w approaches 1/4. If measurement variability were negligible, optimum value of w will be 1/4, which means double weighting for the stage 3 value. is preferred. This curve was obtained equating variability calculated with w = 1/3 and w = 1/4. Points on the curve To assess the loss of efficiency caused by using a fixed have the same variability.