Transcription of UTILITIES DEPARTMENT ORGANIZATIONAL CHART
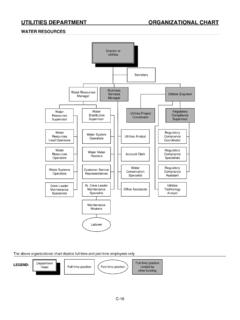
1 UTILITIES DEPARTMENT ORGANIZATIONAL CHART . W ATER RESOURCES. Director of UTILITIES Secretary Business Water Resources Services UTILITIES Engineer Manager Manager Water Water Regulatory UTILITIES Project Resources Distribution Compliance Coordinator Supervisor Supervisor Supervisor Water Regulatory Water System Resources UTILITIES Analyst Compliance Operators Lead Operators Coordinator Water Regulatory Water Meter Resources Account Clerk Compliance Reader Operators Specialists Water Regulatory Water Systems Customer Service Conservation Compliance Operators Representatives
2 Specialist Assistant Crew Leader Sr. Crew Leader UTILITIES Maintenance Maintenance Office Assistants Technology Specialists Specialist Analyst Maintenance Worker Laborer The above ORGANIZATIONAL CHART depicts full-time and part-time employees only DEPARTMENT Head Full-time position LEGEND: funded by other Full-time position Part-time position funded by funds other funding C-16. UTILITIES . DEPARTMENT : UTILITIES PROGRAM: Water/Wastewater Services DIVISION: Water Resources FUND: Water Resources Fund Year-End Actual Adopted Estimated Proposed Proposed 2010-11 2011-12 2011-12 2012-13 2013-14.
3 PROGRAM EXPENSES/REVENUES. Salaries & Benefits $ 4,250,120 $ 4,765,960 $ 4,129,190 $ 4,706,140 $ 4,870,190. Services & Supplies 5,101,110 5,921,840 5,071,840 6,329,120 6,069,500. Total Operating Cost 9,351,230 10,687,800 9,201,030 11,035,260 10,939,690. State Water & CCWA Contract 17,874,910 19,223,520 17,050,970 18,057,100 19,250,800. Capital 631,610 4,082,710 4,557,520 1,725,250 1,488,500. Debt Service 6,626,800 6,629,250 6,632,250 3,430,000 4,900,000. Transfers 530,030 530,030 530,030 541,170 541,170. Total Cost $35,014,580 $41,153,310 $37,971,800 $34,788,780 $37,120,160.
4 SUMMARY OF SERVICE PROGRAMS. Water $30,517,570 $33,738,340 $32,495,160 $28,618,930 $31,066,600. Utility Billing 647,710 714,790 699,850 692,750 710,050. Total Water 31,165,280 34,453,130 33,195,010 29,311,680 31,776,650. Wastewater 3,360,510 5,344,330 3,752,760 4,613,530 4,470,850. Drainage 269,230 797,720 496,010 549,110 552,790. Sewers 219,560 558,130 528,020 314,460 319,870. Total Wastewater 3,849,300 6,700,180 4,776,790 5,477,100 5,343,510. Water Resources Total $35,014,580 $41,153,310 $37,971,800 $34,788,780 $37,120,160.
5 SUMMARY OF POSITIONS. FULL-TIME. Account Clerk I 1 1 1 1 1. Business Services Manager 1 1 1 1 1. Crew Leader/Maint. Spec. 2 2 2 2 2. Customer Service Rep. 2 2 2 2 2. Director of UTILITIES 1 1 1 1 1. Office Assistant I/II 2 2 2 2 2. Regulatory Compliance Assist. 1 1 1 1 1. Regulatory Compliance Coord. 1 1 1 1 1. Regulatory Compliance Spec. 2 2 2 2 2. Secretary 1 1 1 1 1. Sr. Crew Leader/Maint. Spec. 1 1 1 1 1. UTILITIES Technology Analyst 1 1 1 1 1. Water Conservation Specialist 1 1 1 1 1. Water Distribution Supervisor 1 1 1 1 1.
6 Water Meter Reader 1 1 1 1 1. Water Res. Lead Operator 2 2 2 2 2. Water Resources Operator 8 8 8 8 8. Water Resources Manager 1 1 1 1 1. C-17. UTILITIES . DEPARTMENT : UTILITIES PROGRAM: Water/Wastewater Services DIVISION: Water Resources FUND: Water Resources Fund Year-End Actual Adopted Estimated Proposed Proposed 2010-11 2011-12 2011-12 2012-13 2013-14. SUMMARY OF POSITIONS (continued). Water Resources Supervisor 1 1 1 1 1. Water System Operator I 5 6 6 6 6. Water System Operator II 3 3 3 3 3. TOTAL 39 40 40 40 40. PART-TIME.
7 Laborer III 2 1 1 1 1. TOTAL 2 1 1 1 1. GRAND TOTAL 41 41 41 41 41. TEMPORARY (FTE). General Laborer TOTAL TEMPORARY (FTE) PROGRAM DESCRIPTION. Water Resources Water Resources is responsible for supplying the residents of Santa Maria with an adequate supply of potable water for domestic, industrial, and fire protection purposes. The Water Resources Water Production and Distribution Groups have two primary objectives: to produce the highest quality water possible for the City's customers and to distribute water that meets the customer's demands for peak water flow.
8 The drinking water is produced from imported State Water supplies and six active and three standby groundwater production water wells located throughout the Santa Maria service area. The system has a total of 20 million gallons of reservoir capacity. The combined well production and reservoir capacity must supply a peak demand of over 17 million gallons per day, plus an additional 6,000 gallons per minute for at least six hours for fire fighting purposes. This capability must be maintained in the event that two of the largest water sources would be out of service.
9 In 1997, the City began receiving State Water on a full-time basis. State Water provides the City with a reliable, good quality water source, and is the first priority water source for the foreseeable future. The water distribution system delivers water, from the State Water turnout and water wells, to all areas throughout the City. Water is provided to approximately 21,200 accounts through over 324 miles of water main. Routine preventive maintenance is performed on a continuous basis and includes: an annual flushing program; valve turning; and hydrant maintenance.
10 Distribution staff performs meter reading, customer service, and maintains all water distribution facilities, including water mains, water services, and water meters. Additional maintenance duties include storm drain maintenance and flood control. C-18. UTILITIES . DEPARTMENT : UTILITIES PROGRAM: Water/Wastewater Services DIVISION: Water Resources FUND: Water Resources Fund Wastewater The Water Resources Wastewater Division is responsible for providing safe, economical, and efficient treatment of domestic and industrial wastewater.