Transcription of Validation Report 13 - Residues of Pesticides
1 EURL for Cereals and Feeding stuff National Food Institute Technical University of Denmark Validation Report 13 Determination of pesticide Residues in wheat, rye, rice and barley by GC-MS/MS and LC-MS/MS (QuEChERS method) Mette Erecius Poulsen Gitte Andersen December 2013 Page 2 of 30 EURL-CF DTU, National Food Institute CONTENT: 1. introduction .. 3 2. Principle of analysis .. 3 3. Validation design .. 3 4. Chromatograms and calibration 4 5. Validation parameters .. 8 6. Criteria for the acceptance of Validation results .. 9 7. Results and discussion .. 10 8. 10 9. References .. 11 Appendix 1a. MRM transitions GC-MS/MS.. 12 Appendix 1b. MRM transitions for LC-MS/MS.. 13 Appendix 2. Recoveries, repeatability (RSDr), internal reproducibility (RSDR) and Limit of Quantification (LOQ) for Pesticides validated on 5 cereal commodities, wheat, oat, rye, rice and barley.. 15 Appendix 3. Recoveries, repeatability (RSDr) and Limit of Quantification (LOQs) for Pesticides validated on wheat.
2 18 Appendix 4. Recoveries, repeatability (RSDr) and Limit of Quantification (LOQs) for Pesticides validated on rye.. 21 Appendix 5. Recoveries, repeatability (RSDr) and Limit of Quantification (LOQs) for Pesticides validated on rice.. 24 Appendix 6. Recoveries, repeatability (RSDr) and Limit of Quantification (LOQs) for Pesticides validated on 27 Appendix 7: Principles of the QuEChERS method for cereal extraction .. 30 Page 3 of 30 EURL-CF DTU, National Food Institute 1. introduction This Report describes the Validation of the QuEChERS method combined with GC-MS/MS and LC-MS/MS. The method was sought validated for 45 Pesticides in wheat, rye, rice and barley. The QuEChERS method has an extraction and clean-up step, which has been developed to be Quick, Easy, Cheap, Efficient, Rugged and Safe. The method is most commonly used on fruit, vegetables and cereals1. 2. Principle of analysis Sample preparation: The samples is milled with a sieve at 1 mm.
3 Extraction: The sample is shaken and a salt and buffer mixture is added and the sample is shaken again. Clean-up: After centrifugation the supernatant is transferred to a tube and put in -80 degree freezer. When the extract is almost thawed it is centrifuged and the supernatant is transferred to a tube wit h PSA and MgSO4. After shaking and an additional centrifugation step the final extract is diluted 1:1 with acetonitrile to obtain the same matrix concentration as in the calibration standards. Quantification and qualification: The final extract is analysed by GC/MS/MS and LC-MS/MS. GC-MS/MS: The pesticide Residues are separated on a DB5-MS column and detected by tandem mass spectrometry (MS/MS) operating with electron energy at 70 eV, source temperature at 180 C and transfer line at 250 C. The injection volume was 4 l. All Pesticides were detected in the multiple reaction monitoring mode (MRM).
4 For each pesticide two transition were determined. One for quantification and one for qualification. The MRM transitions for the Pesticides and degradation products are given in Appendix 1a. LC-MS/MS: The pesticide Residues are separated on a reversed-phase column and detected by tandem mass spectrometry (MS/MS) by electrospray (ESI). The Validation includes Pesticides determined with both positive and negative ESI. 13C6-carbaryl was used as internal standard for quantification. All Pesticides were detected in the multiple reaction monitoring mode (MRM). For each pesticide precursor ion and 2 product ions were determined. One product ion for quantification and one for qualification. The MRM transitions for the Pesticides and degradation products sought validated are given in Appendix 1b. 3. Validation design The method was south validated for 45 Pesticides or degradation products in wheat, rye, rice and barley, see Table 1.
5 The Validation was performed on 5-6 replicates on each cereals commodity at Page 4 of 30 EURL-CF DTU, National Food Institute each of the three spiking levels; , and mg/kg. A blank sample of each cereal commodity was included. Pesticides included in recovery experiments 1-Naphthylacetamide Emamectin benzoate Metosulam Acetochlor Etridiazole Metrafenone Ametoctradin Fluazinam Napropamide Benfluralin Fluometuron Oryzalin Bromadiolone Fluopicolide Oxadiargyl Carvone Fluopyram Oxyfluorfen Chloridazon Flurochloridone Penflufen Chlorsulfuron Flurprimidole Penthiopyrad Cyflumetofen Fluxapyroxad Pethoxamide Cymoxanil Halosulfuron-methyl Phenmedipham Dazomet Imazamox Pyroxsulam Desmedipham Imazaquin Spiromesifen Dimethachlor Isopyrazam Sulcotrione Dodemorph Metaldehyde Terbuthylazine Dodine Metazachlor Tritosulfuron 4. Chromatograms and calibration curves The calibration curve is determined by the analysis of each of the analysts at least 4 calibration levels, , , and g/ml.
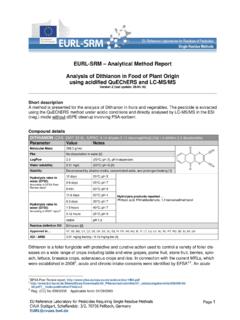
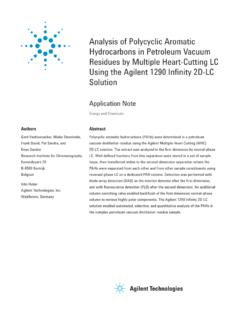
6 The calibration curves were in general best fitted to a linear curve. The quantification was performed from the mean of two bracketing calibration curves. The majority of the correlation coefficients (R) were higher or equal to Examples of chromatograms obtained when analysing the extracts by GC-MS/MS are presented in Figure 1-4. Examples of calibration curves are presented in Figure 5- 8. Page 5 of 30 EURL-CF DTU, National Food Institute Figure 1: Examples of GC-MS/MS chromatograms for penthiopyrad/wheat and tritosulfuron/rice obtained when analysing extract spiked with mg/kg (two MRM transitions are shown for each pesticide). Figure 2: Examples of GC-MS/MS chromatograms tritosulfuron/rye obtained when analysing extract spiked with mg/kg . :MRM of 8 channels,EI+177>101131213st11 Smooth(Mn,2x2) 5. EUPTC-2 spk. ppm B 1:1 + :MRM of 8 channels,EI+302>177131213st11 Smooth(Mn,2x2) 5. EUPTC-2 spk.
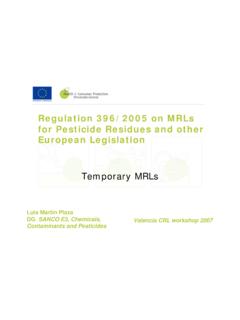
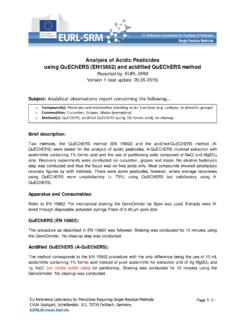
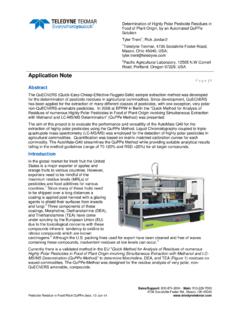
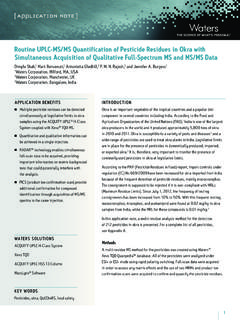
7 Ppm B 1:1 + :MRM of 6 channels,EI+161>141140116st12 Smooth(Mn,2x2) 4. EUPTC-4 spk. ppm A 1:1 + :MRM of 6 channels,EI+145>95140116st12 Smooth(Mn,2x2) 4. EUPTC-4 spk. ppm A 1:1 + 6 of 30 EURL-CF DTU, National Food Institute Figure 3: Examples of LC-MS/MS chromatograms emamectin benzoate/barley obtained in positive mode when analysing extract spiked with mg/kg. Figure 4: Examples of LC-MS/MS chromatograms fluzianam/rice obtained when analysing extract in negative mode spiked with mg/kg :MRM of 6 channels,ES+ > Smooth(SG,1x2) byg + :MRM of 6 channels,ES+ > 158140112_11 Smooth(SG,1x2) byg + of 7 channels,ES-463>416140113_18 Smooth(SG,1x2) ris + of 7 channels,ES-463 > 370140113_18 Smooth(SG,1x2) ris + 7 of 30 EURL-CF DTU, National Food Institute Figure 5. Examples of GC-MS/MS calibration curves for penthiopyrad (concentrations from g/ml) Figure 6. Examples of GC-MS/MS calibration curves for tritosulfuron concentrations fro m g/ml) Compound name: PenthiopyradCorrelation coefficient: r = , r^2 = curve: 453010 * x + type: External Std, AreaCurve type: Linear, Origin: Exclude, Weighting: 1/x, Axis trans: name: TritosulfuronCorrelation coefficient: r = , r^2 = curve: * x + type: External Std, AreaCurve type: Linear, Origin: Exclude, Weighting: 1/x, Axis trans: 8 of 30 EURL-CF DTU, National Food Institute Figure 7.
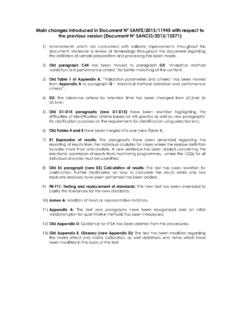
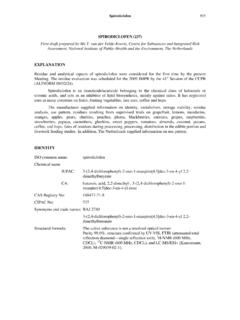
8 Examples of LC-MS/MS calibration curves for emamectin benzoate (concentrations from g/ml). Figure 8. Examples of LC-MS/MS calibration curves for fluazinam (concentrations from g/ml) 5. Validation parameters Precision repeatability and internal reproducibility Repeatability was calculated for all Pesticides and degradation products on all three spiking levels, both for the individual cereal commodities and for the all commodities altogether. Repeatability is Compound name: Emamectin benzoateCorrelation coefficient: r = , r^2 = curve: * x + type: Internal Std ( Ref 1 ), Area * ( IS Conc. / IS Area )Curve type: Linear, Origin: Include, Weighting: 1/x, Axis trans: name: FluazinamCorrelation coefficient: r = , r^2 = curve: * x + type: Internal Std ( Ref 1 ), Area * ( IS Conc. / IS Area )Curve type: Linear, Origin: Exclude, Weighting: 1/x, Axis trans: 9 of 30 EURL-CF DTU, National Food Institute given as the relative standard deviation on the result from two or more analysis at the same sample, done by the same technician, on the same instrument and within a short period of time.
9 The internal reproducibility is calculated for the all the cereal commodities only, because the individual cereal type is analysed on one occasion only. Internal reproducibility is relative standard deviation on results obtained under reproducibility conditions, with the same method on the same sample by different operators within a larger period of time. Repeatability and internal reproducibility in this Validation was calculated from the 5-6 replicate determinations. Repeatability were calculated as given in ISO 5725-22. Appendix 2-6 shows the relative repeatability and internal reproducibility for the validated Pesticides and degradation products. Accuracy Recovery The accuracy was determined by recovery, samples were spiked at three concentration levels. In appendix 2 and 3 recovery, repeatability and limit of quantification (LOQ) are given for the validated Pesticides , isomers and degradation products for all three spiking levels ( mg/kg, mg/kg and mg/kg).
10 Recoveries is listed in Appendix 2-6. Robustness The QuEChERS method has earlier by Anastassiades et al. 20031 in connection with the development of the method been shown to be robust. Limit of quantification, LOQ Quantification limits (LOQ) are calculated from the results at the lowest accepted spike level, as 6 times the standard deviation (absolute recovery). The quantification limits are given in Appendix 2-6. 6. Criteria for the acceptance of Validation results For the Pesticides to be accepted as validated the following criteria for precision and trueness must to be fulfilled: 1. The relative standard deviation of the repeatability should be 20%3. 2. The average relative recovery must be between 70 and 120%3. If the above mentioned criteria have been meet, the quantification limits, LOQs have been calculated. Page 10 of 30 EURL-CF DTU, National Food Institute 7. Results and discussion Overall Validation on all 4 cereal types.