Transcription of Value Stream Mapping Basics - MIT OpenCourseWare
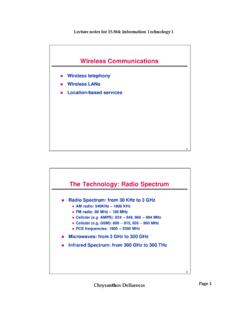
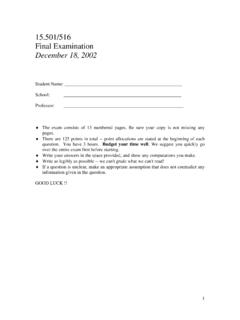
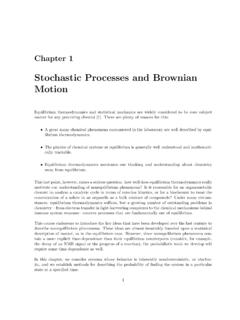
1 Value Stream Mapping Basics Learning Objectives At the end of this module, you will be able to: Sketch a basic Value Stream map Demonstrate basic Value Stream analysis Recognize steps for process improvement using Value Stream Mapping and analysis VSM Basics - Slide 2. 2012 Massachusetts Institute of Technology Hot Dog Stand Process Map $. $. Image by MIT OpenCourseWare . 11 - Clean up 7 6. 1- Take order 9 - Deliver to 8 - Add Yes Order Out customer beverage OK order No ? Yes 5. 2 3 - Get order 4 - Put in bun, Another 10 - Set up In Cook dogs wrap, add fruit dog order ?
2 No How can Sasha and Andy improve their productivity to meet growing customer demand? VSM Basics - Slide 3. 2012 Massachusetts Institute of Technology Five Lean Thinking Fundamentals Specify Value : Value is defined by customer in terms of specific products and services Identify the Value Stream : Map out all end-to-end linked actions, processes and functions necessary for transforming inputs to outputs to identify and eliminate waste Make Value flow continuously: Having eliminated waste, make remaining Value -creating steps flow.
3 Let customers pull Value : Customer's pull cascades all the way back to the lowest level supplier, enabling just-in- time production Pursue perfection: Pursue continuous process of improvement striving for perfection VSM Basics - Slide 4. Ref: James Womack and Daniel T. Jones, Lean Thinking (New York: Simon & Schuster, 1996). 2012 Massachusetts Institute of Technology Value Stream Map (VSM). A tool used to improve a process by identifying added Value and eliminating waste A process map that follows the Value creation process strap yourself to the product (or service).
4 And see where you go . A process map with data added Times: processing, wait, cycle Quality: number of rejects Inventory Resources Number of people Space Distance traveled Whatever else is useful for analyzing the process VSM Basics - Slide 5. 2012 Massachusetts Institute of Technology Steps for Creating a VSM. 1. Define customer Value and the process Walk the process to identify tasks and flows Identify Value -added and waste process steps 2. Create the current state VSM. Gather data on resources, time, quality for each step 3.
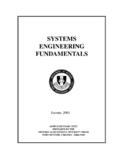
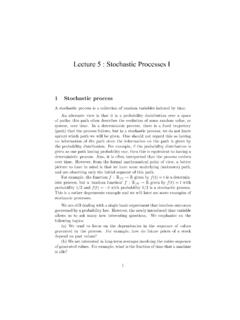
5 Analyze map to determine opportunities for improvement Identify bottlenecks and other flow impediments Brainstorm actions to eliminate waste and add Value 4. Create a future-state map to visualize the desired and realistic next state 5. Create action plans to move toward future state VSM Basics - Slide 6. 2012 Massachusetts Institute of Technology Step 1: S&A Customer Value Current Demand and Process Map 50 customers 100 hot dogs $. $. Customer Value Good food 11 - Clean up Image by MIT OpenCourseWare . Faster service 7 6.
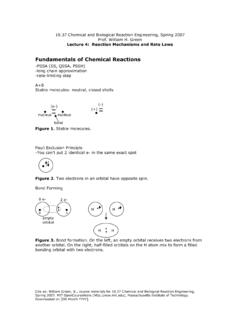
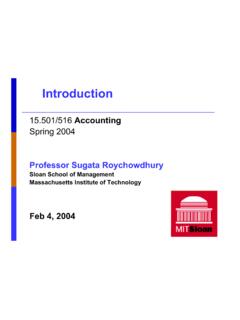
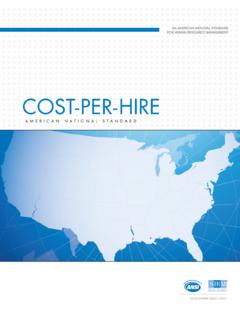
6 1- Take order 9 - Deliver to 8 - Add Yes Order Out customer beverage OK order No ? Yes 5. 2 3 - Get order 4 - Put in bun, Another 10 - Set up In Cook dogs wrap, add fruit dog order ? No This process map follows the Value creation process . Value /waste assessed at each process step . VSM Basics - Slide 7. 2012 Massachusetts Institute of Technology $. Step 2: Add Data $. T = 48 sec Image by MIT OpenCourseWare . Qual = 100%. T = 11 sec 11 - Clean up T = 60 sec T = 10 sec Qual = 90%. T = 30 sec Qual = 100% Qual = 100%.
7 Qual = 100%. 7 T = 33 sec 6. 1- Take order 9 - Deliver to 8 - Add Yes Order Out customer beverage OK. order ? No 10%. Yes 5. 2 3 - Get order 4 - Put in bun, 10 - Set up Another In Cook dogs wrap, add fruit dog order ? T = 48 sec No Qual = 100%. T = 30 sec T = 110 sec T = 44 sec T = 22 sec Qual = 100% Qual = 100%. Display of relevant data completes basic VSM. Images by MIT OpenCourseWare . VSM Basics - Slide 8. 2012 Massachusetts Institute of Technology S&A Takt And Cycle Times Current demand Open from 10AM - 2PM.
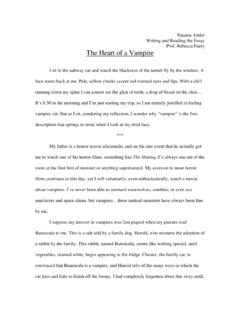
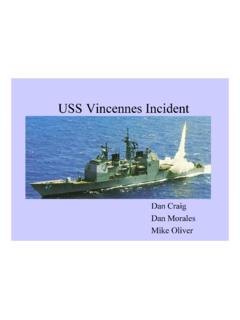
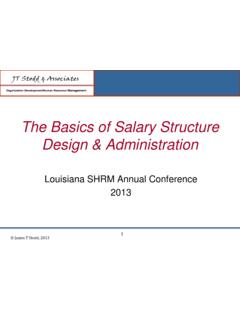
8 50 customers Available time 4hrs 60min /hr Takt time = = = = 288 sec Customer demand 50 customers Cycle time (summed from previous data) = min = 446 sec Valid alternate calculation . assume setup/cleanup is done when things are slow . 10 - Set up 11 - Clean up Available time 4hrs 50min /hr Takt time = = = = 240 sec Customer demand 50 customers Cycle time (excluding set up & clean up) = min = 350 sec Cycle time > takt time, but two workers can demand be met? VSM Basics - Slide 9. 2012 Massachusetts Institute of Technology Step 3: Value Stream Analysis Sasha Andy Image by MIT OpenCourseWare .
9 Image by MIT OpenCourseWare . With your team, take 15 minutes to Calculate the total Value added time Non Value added time Wait time Calculate the total touch time that Sasha and Andy spend on a single order Be ready to report your answers to the class VSM Basics - Slide 10. 2012 Massachusetts Institute of Technology Utilization and Capacity VAT is only slightly over 50% Opportunities for improvement Available time = 4 hours = 240 min Worktime: Touch time per order X number of orders Sasha's tasks: /60 min X 50 cust.
10 = _____ min Andy's tasks: /60 min X 50 cust = _____ min Utilization: Worktime / time available Sasha's: (_____min / 240 min) X 100% = ____%. Andy's: (_____min / 240 min) X 100% = ____%. Capacity: Time available / touch time per order Andy working at 100% = (240min X 60) / _____sec = ___. VSM Basics - Slide 11. 2012 Massachusetts Institute of Technology Utilization and Capacity VAT is only slightly over 50% Opportunities for improvement Available time = 4 hours = 240 min Worktime: Touch time per order X number of orders 133 min Sasha's tasks:159 /60 min X 50 cust.