Transcription of VanguardTotal International Stock Index Fund
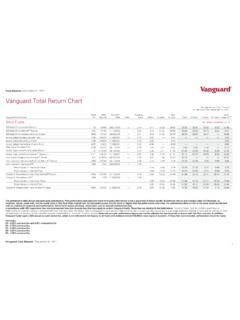
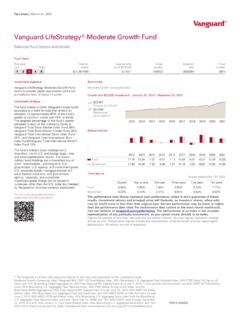
1 Fact sheet | March 31, 2021 vanguard vanguard total International Stock Index FundInternational Stock fund | Institutional Plus SharesFund facts Risk level Low High total net assets Expense ratio as of 02/26/21 Ticker symbol Turnover rate as of 10/31/20 Inception date Fund number 12345 $28,294 MM %VTPSX %11/30/10 1870 Investment objectiveVanguard total International Stock Index Fund seeks to track the performance of a benchmark Index that measures the investment return of stocks issued by companies located in developed and emerging markets, excluding the United States. BenchmarkPrimary : Spl total International Stock Index , Fair-valued priced : FTSE Global All Cap ex US FV Ix Growth of a $10,000 investment : January 31, 2011 December 31, 2020 $16,442 Fund as of 12/31/20 $16,437 Benchmark as of 12/31/20 Annual returnsSpl total International Stock Index : total International Composite Index through August 31, 2006; MSCI EAFE + Emerging Markets Index through December 15, 2010; MSCI ACWI ex USA IMI Index through June 2, 2013; and FTSE Global All Cap ex US Index thereafter.
2 Benchmark returns are adjusted for withholding taxes. F1870 032021 Investment strategyThe fund employs an indexing investment approach designed to track the performance of the FTSE Global All Cap ex US Index , a free-float-adjusted market-capitalization-weighted Index designed to measure equity market performance of companies located in developed and emerging markets, excluding the United States. The Index includes more than 5,300 stocks of companies located in 46 countries. The fund invests substantially all of its assets in the common stocks included in its target Index . For the most up-to-date fund data, please scan the QR code below. 2011 2012 2013 2014 2015 2016 2017 2018 2019 2020 Annual returns2011 2012 2013 2014 2015 2016 2017 2018 2019 2020 Fund Benchmark total returnsPeriods ended March 31, 2021 total returnsQuarter Year to date One year Three years Five years Ten years Fund Benchmark FVP Benchmark The performance data shown represent past performance, which is not a guarantee of future results.
3 Investment returns and principal value will fluctuate, so investors shares, when sold, may be worth more or less than their original cost. Current performance may be lower or higher than the performance data cited. For performance data current to the most recent month-end, visit our website at . Figures for periods of less than one year are cumulative returns. All other figures represent average annual returns. Performance figures include the reinvestment of all dividends and any capital gains distributions. All returns are net of expenses. Market allocation stocks Japan China United Kingdom Canada France Germany Switzerland Australia Taiwan Korea Fact sheet | March 31, 2021 vanguard total International Stock Index FundInternational Stock fund | Institutional Plus SharesConnect with vanguard > Plain talk about risk An investment in the fund could lose money over short or even long periods.
4 You should expect the fund s share price and total return to fluctuate within a wide range, like the fluctuations of the overall Stock market. The fund s performance could be hurt by: Stock market risk : The chance that Stock prices overall will decline. Stock markets tend to move in cycles, with periods of rising Stock prices and periods of falling Stock prices. The fund s investments in foreign stocks can be riskier than Stock investments. Foreign stocks tend to be more volatile and less liquid than stocks . The prices of foreign stocks and the prices of stocks may move in opposite directions. In addition, the fund s target Index may, at times, become focused in stocks of a particular market sector, which would subject the fund to proportionately higher exposure to the risks of that sector. Country/Regional risk : The chance that world events such as political upheaval, financial troubles, or natural disasters will adversely affect the value of securities issued by companies in foreign countries or regions.
5 Because the fund may invest a large portion of its assets in securities of companies located in any one country or region, its performance may be hurt disproportionately by the poor performance of its investments in that area. Country/Regional risk is especially high in emerging markets. Currency risk : The chance that the value of a foreign investment, measured in dollars, will decrease because of unfavorable changes in currency exchange rates. Investment style risk : The chance that returns from small- and mid-capitalization stocks , to the extent that the fund invests in them, will trail returns from the overall Stock market. Historically, these stocks have been more volatile in price than the large-cap stocks that dominate the overall market, and they often perform quite differently. Emerging markets risk : The chance that the stocks of companies located in emerging markets will be substantially more volatile, and substantially less liquid, than the stocks of companies located in more developed foreign markets because, among other factors, emerging markets can have greater custodial and operational risks; less developed legal, tax, regulatory, and accounting systems; and greater political, social, and economic instability than developed markets.
6 Note on frequent trading restrictions Frequent trading policies may apply to those funds offered as investment options within your plan. Please log on to for your employer plans or contact Participant Services at 800-523-1188 for additional information. London Stock Exchange Group companies include FTSE International Limited ( FTSE ), Frank Russell Company ( Russell ), MTS Next Limited ( MTS ), and FTSE TMX Global Debt Capital Markets Inc. ( FTSE TMX ). All rights reserved. FTSE , Russell , MTS , FTSE TMX and FTSE Russell and other service marks and trademarks related to the FTSE or Russell indexes are trademarks of the London Stock Exchange Group companies and are used by FTSE, MTS, FTSE TMX and Russell under licence. All information is provided for information purposes only. No responsibility or liability can be accepted by the London Stock Exchange Group companies nor its licensors for any errors or for any loss from use of this publication.
7 Neither the London Stock Exchange Group companies nor any of its licensors make any claim, prediction, warranty or representation whatsoever, expressly or impliedly, either as to the results to be obtained from the use of the FTSE Indexes or the fitness or suitability of the Indexes for any particular purpose to which they might be put. For more information about vanguard funds or to obtain a prospectus, see below for which situation is right for you .If you receive your retirement plan statement from vanguard or log on to vanguard s website to view your plan, visit or call 800-523-1188 .If you receive your retirement plan statement from a service provider other than vanguard or log on to a recordkeeper s website that is not vanguard to view your plan, please call 855-402-2646 .Visit to obtain a prospectus or, if available, a summary prospectus .Investment objectives, risks, charges, expenses, and other important information about a fund are contained in the prospectus; read and consider it carefully before investing.
8 Financial advisor clients: For more information about vanguard funds, contact your financial advisor to obtain a prospectus. Investment Products: Not FDIC Insured No Bank Guarantee May Lose Value 2021 The vanguard Group, Inc. All rights reserved. vanguard Marketing Corporation, Distributor. F1870 032021 Sector Diversification Financials Consumer Discretionary Technology Industrials Health Care Basic Materials Consumer Staples Energy Real Estate Telecommunications Utilities Other Sector categories are based on the Industry Classification Benchmark system ( ICB ), except for the Other category (if applicable), which includes securities that have not been provided an ICB classification as of the effective reporting period. Beginning September 2020, FTSE Russell is enhancing the ICB structures to provide additional granularity from the industry through subsector levels. Please note that there may be differences in sector names and classifications as these changes are implemented across the industry through March 2021.
9 Ten largest holdings *1 Taiwan Semiconductor Manufacturing Co. Ltd. 2 Tencent Holdings Ltd. 3 Alibaba Group Holding Ltd. 4 Samsung Electronics Co. Ltd. 5 Nestle SA 6 ASML Holding NV 7 Roche Holding AG 8 Toyota Motor Corp. 9 Novartis AG 10 LVMH Moet Hennessy Louis Vuitton SE Top 10 as %of total net assets * The holdings listed exclude any temporary cash investments and equity Index products.