Transcription of Variable Speed Drive (VSD) for Irrigation Pumping - USDA
1 United States Department of Agriculture NATURAL RESOURCES CONSERVATION SERVICE Engineering Technical Note No. MT-14 January 2010 Variable Speed Drive (VSD) for Irrigation Pumping Pumping water for Irrigation can be a major expense for irrigated farms. In 2003 more than 500,000 pumps were used for Irrigation , and the total estimated energy cost nationwide was over billion dollars. Improving the efficiency of Irrigation pumps has many benefits, including improving the profitability of the irrigated farm. When a single pump is required to operate over a range of flow rates and pressures, standard procedure is to design the pump to meet the greatest output demand of both flow and pressure.
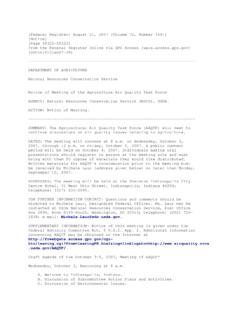
2 For this reason, pumps are often oversized and they will be operating inefficiently over a range of duties. This common situation presents an opportunity to reduce energy requirements by using control methods such as a Variable Speed Drive . Most existing systems requiring a control method use bypass lines, throttling valves, multiple pumps, or pump Speed adjustments. Figures 1 through 3 illustrate common control methods including Variable Speed and the potential energy savings. Often, changing the pump s Speed is the most efficient method of control. When a pump s Speed is reduced, less energy is used by the pump s power unit and therefore less energy needs to be dissipated or bypassed.
3 Figure 1 Bypass control energy use Figure 2 Throttle control energy use NRCS Montana Technical Note Engineering MT-14 1 Figure 3 Speed control energy use Pump Speed refers to the rotational Speed of the pump shaft. The shaft is connected to the impeller; the impeller adds energy to the water. Slowing the rotation of the impeller reduces the energy that is transferred to the water and thereby the power requirement of the pump. Pump Speed can be controlled in a number of ways: Mechanical ( Drive line directly connected to a Variable Speed engine) Hydraulic (hydraulic coupling) Variable - Speed pulley arrangements Changeable gearbox (constant- Speed input with Variable - Speed output) Magnetic coupling (constant- Speed input with Variable - Speed output) Electrical (induction motors using a Variable frequency Drive ) Pumping System Hydraulic Characteristics Pumps can be placed into several broad categories including positive displacement and rotodynamic.
4 Most pumps used for agricultural Irrigation Pumping are rotodynamic meaning that they transfer energy to the water by means of a rotating impeller. Pumps add energy to the water by: raising the height (elevation) of the water and increasing the pressure of the water as it exits the pumps. This pressure is used to move the water through the Irrigation system and overcome losses. When evaluating pumps, a system approach should be used that includes all components, energy inputs (via pumps), pressurization requirements of the Irrigation system and energy to overcome friction losses in the system.
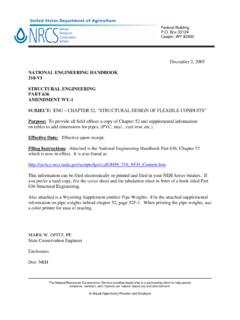
5 NRCS Montana Technical Note Engineering MT-14 2 The total energy requirement for a Pumping system is defined by the static head and the friction head requirements of the system. In Pumping systems, total energy is often referred to as total dynamic head. Total dynamic head has two components: static head and friction head. Static head is the sum of the difference in elevation of the supply and delivery point of the liquid being moved plus pressure head. Static head is independent of flow rate, Figure 4. Figure 4 Static Head Loss Figure 5 Friction Head Loss Friction head is the energy required to overcome friction losses in the system caused by the water being moved in and through pipes, valves, and other components in the system.
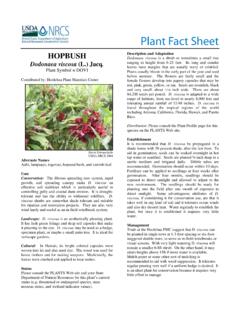
6 This loss is proportional to the square of the flow rate as shown in Figure 5. The third component of total dynamic head is the velocity head. This component is generally small in Irrigation systems, and is often ignored because it is normally insignificant in comparison to static and friction head components. In order to select a proper pump the system operating characteristics need to be known. A system curve relating flow rate to total head needs to be developed. In general the system curve will consist of the sum of the static and friction heads as shown in Figure 6. Figure 6 System curve The performance of a pump is typically shown graphically in a pump curve.
7 A pump curve shows the relationship between total dynamic head and flow rate. Rotodynamic pumps have curves where the head falls gradually with increasing flow as shown in Figure 7. NRCS Montana Technical Note Engineering MT-14 3 NRCS Montana Technical Note Engineering MT-14 4 When a pump curve and a system curve are combined, the intersection of the pump and system curve is the point where the pump will operate, Figure 8. Figure 7 Pump Curve Figure 8 Pump and system curve intersection Pump operation characteristics are related to the rotational Speed of the pump.
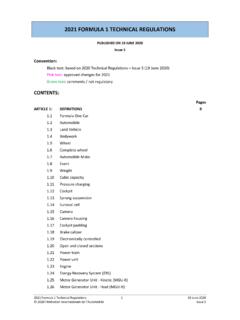
8 The equations relating pump performance parameters to Speed are known as the Affinity Laws. 32312221212121 2 BHP1 BHP HH QQ Where: Q = flow rate H = head or pressure BHP = brake horsepower (hp) = rotational shaft Speed (rpm). Figure 9 demonstrates how the pump curve changes with shaft Speed . As the rotational shaft Speed (and thus the pump impeller) changes, the pump curve shifts accordingly. Figure 9 Pump curve changes with shaft Speed As demonstrated by the Affinity Laws and shown in Figure 9, a change in pump Speed greatly affects the power requirements; a slight reduction in Speed can result in a significant reduction in input power.
9 The potential energy saved varies depending upon the type of Irrigation system supplied and pump selected. When the Pumping head required by a system is mainly friction loss, reducing the Speed causes the pump s operating point on the system curve to follow the path of the efficiency curve and allows the system to operate over a range of speeds at or near the Best Efficiency Point (BEP) of the pump. The reduction in flow varies proportionally to Speed , and the affinity laws accurately predict flow rate and head changes as well as power savings (see Figure 10). When the majority of Pumping head required by a system is due to static head, ( , when most of the work of the pump is used to lift the water to a certain elevation) changing the Speed of the pump will cause the system curve to cross through more efficiency lines and not follow the BEP.
10 The flow reduction is no longer directly proportional to Speed change. Not only are energy savings not as great but they are more problematic to calculate because of difficulties in determining the change in pump efficiencies (see Figure 11). The shape of the pump curve also has an effect on the potential energy saved. Pumps with steeper curves have more potential to save more energy. Flat-curved pumps will have less energy savings (see Figures 12 and 13). Figure 10 System curve parallel with Figure 11 System curve crosses efficiency curves efficiency curves NRCS Montana Technical Note Engineering MT-14 5 NRCS Montana Technical Note Engineering MT-14 6 Figure 12 Potential savings flat pump curve Figure 13 Potential savings steep pump curve Variable Speed Electric Motors Most Variable Speed applications involving an electric motor generally employ a Variable frequency Drive (VFD).