Transcription of Vehicle Fires - NFPA
1 Vehicle FiresMarty Ahrens March 2020 Copyright 2020 National fire Protection Association ( nfpa ) nfpa Research pg. 1 Key findings An estimated 212,500 Vehicle Fires caused 560 civilian deathsi 1,500 civilian injuries; and $ billion in direct property damage in the US during 2018. In 2018, only Fires in one- and two-family homes claimed more lives than Vehicle Fires . Vehicle Fires caused times the number of deaths as nonresidential structure Fires and times the number of apartment fire deaths. Most of this report focuses on highway Vehicle Fires . ii The vast majority of Vehicle Fires and Vehicle fire casualties involve highway vehicles (vehicles intended for use on roadways). The 2018 estimate of highway Vehicle Fires was 60 percent lower than in 1980, and the rates of Fires per billion miles driven and fire deaths per 100 billion miles driven were 81 percent and 65 percent lower, respectively.
2 Four of every five people killed or injured in highway Vehicle Fires in 2013 2017 were male. Almost half (44 percent) of the Vehicle fire fatalities were between 15 and 34. Only 10 percent were at least 65 years of age. Highway Vehicle Fires were most common between 3:00 and 6:00 i Unless otherwise specified, firefighter deaths and injuries are excluded from casualty statistics. ii The term highway Vehicle fire is used to describe Fires in which cars, trucks, motorcycles, buses, and other road vehicles burned, regardless of where the fire occurred. However, if a Vehicle inside a structure caught fire and spread to the structure or other contents, that fire would be considered a structure fire . The leading causes of Vehicle Fires were mechanical failures or malfunctions and electrical failures or malfunctions.
3 Older vehicles accounted for three-quarters of the highway Vehicle Fires caused by mechanical or electrical failures or malfunctions. Maintenance is important throughout the Vehicle s years of use. Collisions were the leading cause of Vehicle Fires that resulted in death. Large trucks have a higher rate of deaths per 1,000 Fires than highway Vehicle Fires overall. Tires play a larger role in large truck and bus Fires than in car Fires . Additional information can be found in the supporting tables for this report. nfpa Research pg. 2 The big picture US fire departments responded to an estimated 212,500 Vehicle Fires in the United States during 2018. These Fires caused an estimated 560 civilian deaths; 1, 500 civilian injuries; and $ billion in direct property Vehicle Fires accounted for 16 percent of the million Fires reported to US fire departments.
4 Vehicle Fires also caused 15 percent of all civilian fire deaths and 10 percent of all reported civilian fire injuries. In 2018, only Fires in one- and two- family homes claimed more lives than Vehicle Fires . Vehicle Fires caused times the number of deaths as nonresidential structure Fires and times the number of apartment fire deaths. Trends in highway Vehicle use and Fires Highway vehicles, such as cars, trucks, buses, motorcycles, and recreational vehicles, accounted for the majority of Vehicle Fires . The term highway Vehicle fire is used to describe Fires in which road vehicles burned, regardless of where the fire occurred, including inside if the fire did not spread from the Vehicle to the structure. According to the National Highway Traffic Safety Administration s (NHTSA s) Traffic Safety Facts 2017, in that year, the US had 225 million drivers with 290 million registered Today s vehicles are older than in the past.
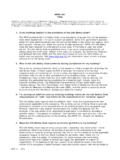
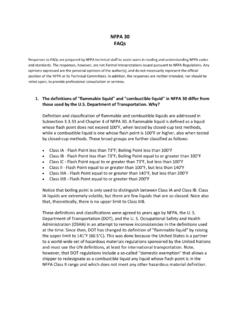
5 According to the Federal Highway Administration (FHWA), there were 223 million household vehicles (as opposed to commercial vehicles) in the US in 2017, with an average of vehicles and licensed drivers per household. In 1983, the average household Vehicle was years old, compared to years old in Despite the increase in highway vehicles, miles driven, and Vehicle age, highway Vehicle Fires are less common than in the past. Figure 1 shows that the estimate of highway Vehicle Fires was 60 percent lower in 2018 than in 1980. Fewer than 200,000 such Fires were reported annually in the past decade. In 2018, an estimated 181,500 highway Vehicle Fires caused 490 deaths; 1,300 injuries; and $ billion in direct property damage. The fire trend data in this section is based on national estimates from the nfpa fire experience survey as presented in nfpa s fire Loss in the United States Because fire deaths are less common than Fires , it is not surprising that death estimates are more volatile.
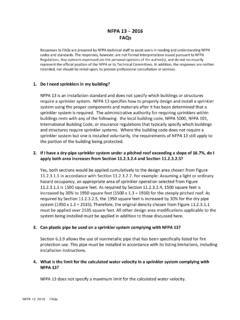
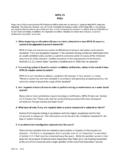
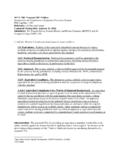
6 Figure 2 shows that the estimated annual fire deaths had settled in the range of 260 310 for most of the past decade. However, estimates for 2015, 2017, and 2018 were substantially higher. The 2018 estimate was the highest since 2005. 4564592071641820100200300400500in ThousandsFigure 1. Highway Vehicle Fires by year65080026049002004006008001000 Figure 2. Highway Vehicle fire deaths by yearNFPA Research pg. 3 The number of miles driven by highway vehicles has more than doubled from 1,527 billion in 1980 to 3,255 billion in Figure 3 shows that the number of Vehicle Fires per billion miles driven has fallen 81 percent over the same period. The decline has been fairly steady over time. Sources: nfpa s fire Loss in the United States series, US Department of Transportation, Federal Highway Administration Office of Highway Policy Information.
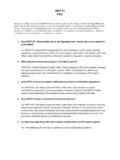
7 Figure 4 shows that even with the recent increases in highway Vehicle fire deaths, the fire death rate per 100 billion miles was still 65 percent lower in 2018 than in 1980. The 2013 2017 estimates that follow were derived from nfpa s annual fire department experience survey and the detailed data from the US fire Administration s (USFA s) National fire Incident Reporting System (NFIRS). At the time this analysis was done, NFIRS data for 2018 was not yet available. Sources: NFP fire Loss in the United States series, US Department of Transportation, Federal Highway Administration Office of Highway Policy Information. Sources: nfpa s iii If a Vehicle inside a structure caught fire and spread to the structure or other contents, that fire would be considered a structure fire .
8 Iv Percentages were calculated from the 2013 2017 total Vehicle fire estimates derived from NFIRS and the nfpa fire experience survey. fire Loss in the United States series, US Department of Transportation, Federal Highway Administration Office of Highway Policy Information. Patterns of highway Vehicle Fires The 181,700 highway Vehicle firesiii per year in 2013 2017 caused an average of 355 civilian deaths; 1,172 civilian injuries; and $ billion in direct property damage. These Fires accounted for 92 percent of all reported Vehicle Fires , 91 percent of Vehicle fire deaths, 81 percent of Vehicle fire injuries, and 74 percent of Vehicle fire dollar loss. Highway Vehicle Fires accounted for 14 percent of reported Fires of all types, 11 percent of fire deaths, 8 percent of fire injuries, and 9 percent of total fire dollar The remainder of this report will focus on highway Vehicle Fires .
9 29956050100150200250300350 Figure 3. Highway Vehicle Fires per billion miles driven43150102030405060 Figure 4. Highway Vehicle fire deaths per 100 billion miles drivenNFPA Research pg. 4 The victims of highway Vehicle Fires Four out of five fatal highway Vehicle fire victims (79 percent) and the non-fatally injured (80 percent) were male. This is somewhat higher than the 71 percent of all highway crash fatalities who were Victims of fatal highway Vehicle Fires tend to be close in age to overall crash victims. This is consistent with the fact that three of every five highway Vehicle fire deaths resulted from Fires caused by collisions or overturns. Figure 5 shows that almost half (44 percent) of the Vehicle fire fatalities were between 15 and 34, compared to 38 percent of all crash O nly 10 percent of highway Vehicle fire fatalities and 18 percent of all crash victims were 65 years old or older.
10 When are highway Vehicle Fires most common? Highway Vehicle Fires were most common from May through August, peaking in July. Vehicle fire deaths were more common in Fires on Saturdays and Sundays. According to NHTSA, Saturday was the peak day for fatal Vehicle crashes in 2017, followed by Sunday and Friday. Eighteen percent of the fatal crashes on Sundays occurred between midnight and 3:00 T his suggests a continuation of Saturday night activities might have been a factor in Sunday s larger share of deaths. Highway Vehicle fire times appear to correlate with the times vehicles are in use. The smallest number of Fires occurred between 4:00 and 6:00 Fires increased steadily throughout the day, peaking between 3:00 and 6:00 , likely due to rush hour traffic.