Transcription of 研究統計分析的介紹與應用 進階 - vghtc
1 ( )1 -1 Independent t testANOVAP earson CorrelationPaired t test ( )WilcoxonRank Sum test (Mann-Whitney U test)Kruskal-Wallis testSpearman's rhoWilcoxonsigned- rank test Chi-square ( 2) test Fisher s exact Yate s Chi-square ( 2) testMcNemar stest2 / 3 Independent variable Dependent variable (Outcome variable) -2 (X) (Y) (Linear regression) (Logistic regression) (Cox Proportional Hazard Regression Model,Cox. Model)4 (Regression)5 Linear RegressionLogistic Regression (Y) (X)1 1 (Simple Regression Analysis) (Multiple Regression Analysis) (UnivariateLogistic Regression) (Multivariate Logistic Regression) (Dummy variable) Linear Regression-1 ( vs ) ( vs ) ( vs ) BMI 6 Linear Regression-2 ( vs ) (X) (Y) 7 B95% < ** Regression.
2 *p< , **p< (A) B95% < ** Regression. *p< , **p< SPSS -181 SPSS -2932 SPSS -3104 SPSS -411 SPSS -512 B95% < ** Regression. *p< , **p< SPSS -613 ( vs ) 12 SPSS -714 (A) ( vs ) (A) B95% < ** Regression. *p< , **p< SPSS -815 B95% < ** Regression. *p< , **p< (A) B95% < ** Regression. *p< , **p< 1 1mmHg Linear Regression-3 ( vs ) (0 & 1) SPSS -117 SPSS -218 SPSS -319 B95% < ** Regression. *p< , **p< sex=0( ) sex=1( )2. Regression-420 ( vs ) variable 2 (0&1) SPSS -12121 SPSS -222 SPSS -323 B95%CIpvalueage< < ** age> < ** Regression.
3 *p< , **p< ( vs ) Linear Regression-5 BMI BMI UnivariateRegression AnalysisMultiple Regression AnalysisB95%CIpvalueB95% < ** < ** < ** < ** < ** < ** Regression. *p< , **p< SPSS -12521 SPSS -226 SPSS -327 BMI BMI Univariate Regression AnalysisMultiple Regression AnalysisB95%CIpvalueB95% < ** < ** < ** < ** < ** < ** Regression. *p< , **p< 1. BMI 2. BMI BMI 1 (kg/m2) Regression28 Logistic Regression-1 (Odds Ratio, OR) (Y) -0&1 (X) BMI 29 Logistic Regression-2 (0 & 1) SPSS -1311 SPSS -23223 SPSS -33345 SPSS -434 BOR95% *Logistic regression.
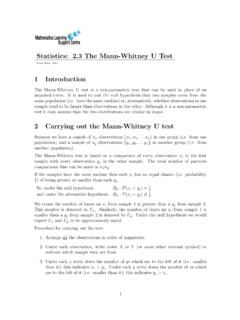
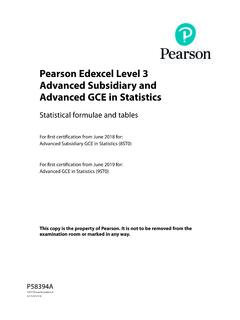
4 *p< , **p< Regression-3 SPSS -1361 SPSS -237234 SPSS -338 BOR95% Logistic regression. *p< , **p< Logistic Regression-4 BMI SPSS -140 SPSS -241 BMI Univariate Regression AnalysisMultiple Regression AnalysisOR95%CIpvalueOR95% * < ** **Logistic regression. *p< , **p< SPSS -342 43 -1 (Dependent variable, Outcome variable) (time-to-event) ( ) (event) 44 -2 (Complete data)45 (Censored data)SubjectABCDE2000 20022004200620082010 DeadDeadDeadDeadDeadCalendar YearsSubjectABCDE2000 20022004200620082010 DeadDeadCalendar YearsLost to follow-upaliveLost to follow-up -3 46 SubjectABCDEFG80 81 82 83 84 85 86 87 88 89 90 Calendar Years (Calendar Time) 1980 1990 7 ( initial follow-up, death, alive)7+611+956+7+SurvivalTime (Patient time) 1980 1990 7 ( initial follow-up, death, alive) (2008)
5 0 ( ,Day zero) SubjectABCDEFG0 1 2 3 4 5 6 7 8 9 10 Years & ( ) ( ) - 0 / / - (0/1)47 -Excel48 ? -SPSS(Variable)49 -SPSS(Data)50 ( ) 0 ( ) Kaplan-Meier Survival Analysis Log rank test Cox Proportional Hazards Model51 Kaplan-Meier 1521234 Kaplan-Meier 253567 Kaplan-Meier 354889 Kaplan-Meier 455 Kaplan-Meier 556 (Step function) Step- Kaplan-Meier 657 758 (Complete data)-1 Kaplan-Meier 8 (Complete data)-259 9 Log rank test ( )
6 Pvalue60 Kaplan-Meier 1061123 Kaplan-Meier 1162 Cox model-1 Cox Proportional Hazards Model p p - (Hazards Ratio)63 Cox model-2641234 Cox model-365567 Cox model-4668910 model-56711 model-668 ( ) (0)Cox model-769HR(95%CI)pvalue ( ) ( ) ** ( )< ** (Outcome) 70 Logistic Regression orCox Regression ?! Logistic regression Cox regression (Censored data) HR baseline 71