Transcription of Violent Victimization by Race or Ethnicity, 2005-2019
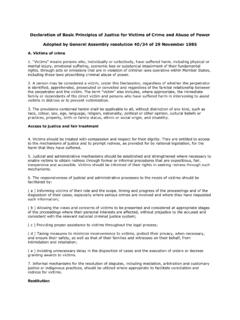
1 Department of JusticeOffice of Justice ProgramsBureau of Justice StatisticsSelected FindingsOctober 2020 NCJ 255578 National crime Victimization SurveyViolent Victimization by Race or Ethnicity, 2005-2019 Rate of Violent victimizationsFrom 2005 to 2019 The overall rate of Violent Victimization fell 26% (from to victimizations per 1,000 residents age 12 or older). The rate of Violent Victimization against black persons fell 43% (from to Violent victimizations per 1,000 black persons age 12 or older). The rate of Violent Victimization against white persons fell 24% (from to victimizations per 1,000 white persons age 12 or older).
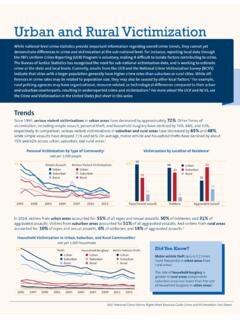
2 Number of Violent victimizationsFrom 2005 to 2019 The overall number of Violent victimizations fell 16% (falling by million). The number of Violent victimizations against black persons fell 32% (from 913,000 to 623,000). The number of Violent victimizations against white persons fell 24% (from million to million). Table 1 Rate of Violent victimizations, by victim race or ethnicity, 2005-2019 Victim race/ethnicity20052006200720082009201020 1120122013201420152016201720182019* , : Rates are per 1,000 persons age 12 or older. Violent - crime categories include rape or sexual assault, robbery, aggravated assault, and simple assault, and they include threatened, attempted, and completed occurrences of those crimes.
3 BJS created standard errors and presented testing for statistically significant differences among National crime Victimization Survey (NCVS) estimates in this table using generalized variance function parameters. See appendix table 1 for standard for 2006 should not be compared to other years and are excluded from this table. See Criminal Victimization , 2007 (NCJ 224390, BJS, December 2008).*Comparison year. Difference with comparison year is significant at the 95% confidence level. Difference with comparison year is significant at the 90% confidence persons of Hispanic origin ( , white refers to non-Hispanic whites and black refers to non-Hispanic blacks).
4 BIncludes Asians, Native Hawaiians, other Pacific Islanders, American Indians, Alaska Natives, and persons of two or more : Bureau of Justice Statistics, NCVS Victimization Analysis Tool, OF STATISTICSV iolent Victimization by Race and Ethnicity, 2005-2019 | October 2020 2 Table 2 Number of Violent victimizations, by victim race or ethnicity, 2005-2019 Victim race/ethnicity20052006200720082009201020 1120122013201420152016201720182019*Total 6,947,800 --6,814,180 6,393,4705,669,2404,935,980 5,812,5206,842,600 6,126,4205,359,570 5,006,610 5,353,8205,612,670 6,385,5205,813,410 Whitea4,751,150 --4,606,610 4,499,130 3,737,2203,182,1703,719,7304,351,420 3,832,5303,517,460 3,016,220 3,391,570 3,561,030 4,238,940 3.
5 591,900 Blacka912,640 --997,890 823,100905,020 786,810812,1701,096,540 815,060738,530 752,750 749,820 712,970 675,330622,960 Hispanic821,700--771,790701,530 785,590603,800 895,430976,3201,015,670669,380 724,720 810,100940,720 872,5501,019,880 Othera,b462,310--437,890369,710 241,400 363,200 385,190 418,320463,160434,210 512,930 402,330 397,950 598,700578,680 Note: Details may not sum to totals due to rounding. Violent - crime categories include rape or sexual assault, robbery, aggravated assault, and simple assault, and they include threatened, attempted, and completed occurrences of those crimes.
6 BJS created standard errors and presented testing for statistically significant differences among National crime Victimization Survey (NCVS) estimates in this table using generalized variance function parameters. See appendix table 2 for standard for 2006 should not be compared to other years and are excluded from this table. See Criminal Victimization , 2007 (NCJ 224390, BJS, December 2008).*Comparison year. Difference with comparison year is significant at the 95% confidence level. Difference with comparison year is significant at the 90% confidence persons of Hispanic origin ( , white refers to non-Hispanic whites and black refers to non-Hispanic blacks).
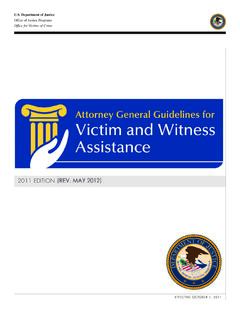
7 BIncludes Asians, Native Hawaiians, other Pacific Islanders, American Indians, Alaska Natives, and persons of two or more : Bureau of Justice Statistics, NCVS Victimization Analysis Tool, Victimization by Race or Ethnicity, 2005-2019 | October 2020 3appendix Table 1 Standard errors for table 1: Rate of Violent victimizations, by victim race or ethnicity, 2005-2019 Victim ~ ~ ~ ~ ~ : BJS created the standard errors in this table using generalized variance function parameters.~Not : Bureau of Justice Statistics, NCVS Victimization Analysis Tool, Table 2 Standard errors for table 2: Number of Violent victimizations, by victim race or ethnicity, 2005-2019 Victim race/ethnicity20052006200720082009201020 1120122013201420152016201720182019 Total399,741~388,012404,138332,673368,83 3356,534313,834427,599326,328312,236259, 442279,729358,555318,922 White343,801~368,749346,765345,851305,45 6299,982290,013355,777289,072270,281238, 717243,775306,561265,028 Black111,654~122,803111,674129,532113,69 9103,885115,810118,91999,148104,69385,65 782,49585,93380,347 Hispanic103,996~101,834100,573117,50494, 305111,171107,299138,99892,756102,04390, 22099,215102,496112,071 Other70,664~67,29066,47252,74165.
8 95762,09961,98079,74669,30680,87356,6285 6,23179,12576,472 Note: BJS created the standard errors in this table using generalized variance function parameters.~Not : Bureau of Justice Statistics, NCVS Victimization Analysis Tool, Bureau of Justice Statistics of the Department of Justice is the principal federal agency responsible for measuring crime , criminal Victimization , criminal offenders, victims of crime , correlates of crime , and the operation of criminal and civil justice systems at the federal, state, tribal, and local levels. BJS collects, analyzes, and disseminates reliable statistics on crime and justice systems in the United States, supports improvements to state and local criminal justice information systems, and participates with national and international organizations to develop and recommend national standards for justice statistics.
9 Jeffrey H. Anderson is the tables were prepared by Barbara A. Oudekerk. Erika Harrell verified the tables. Edrienne Su edited the tables. Carrie Epps-Carey produced the 2020, NCJ 255578 Office of Justice ProgramsBuilding Solutions Supporting Communities Advancing