Transcription of Viscofan SA VIS Q - Bolsa de Madrid
1 Quantitative Equity Report | Release: 10 Aug 2018, 23:01 UTC | Reporting Currency: EUR | Trading Currency: EUR | Exchange:XMAD Page 1 of 4. Viscofan SA VIS QQ 10 Aug 2018 02:00 UTC. Last Close Fair ValueQ Market Cap Sector Industry Country of Domicile 10 Aug 2018 10 Aug 2018 02:00 UTC 10 Aug 2018. 2, Mil s Consumer Defensive Packaged Foods ESP Spain There is no one analyst in which a Quantitative Fair Value Estimate and Quantitative Star Rating are attributed to; however, Mr. Lee Davidson, Head of Quantitative Price vs. Quantitative Fair Value Research for Morningstar, Inc., is responsible for overseeing the methodology that 2014 2015 2016 2017 2018 2019 Quantitative Fair Value Estimate supports the quantitative fair value.
2 As an employee of Morningstar, Inc., Mr. Total Return Davidson is guided by Morningstar, Inc.'s Code of Ethics and Personal Securities Trading Policy in carrying out his responsibilities. For information regarding Conflicts Sales/Share 80. of Interests, visit Forecast Range Forcasted Price 64 Dividend Company Profile Split Viscofan SA is a Spanish producer and distributor of artificial Momentum: . 48. casings for the meat industry. The company offers both Standard Deviation: natural and synthetic materials for the customised casing and Liquidity: Medium 32. animal gut meat processing industry. Its business segments are cellulose, collagen, plastic, nonpack films, fibrous, and 52-Wk machinery. The breakdown by geographical area is: North 16.
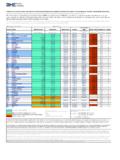
3 America, with approximately one third of sales, Europe and 5-Yr Asia, with more than half of sales; and Latin America. Total Return %. +/ Market (Morningstar World Index). Quantitative Scores Scores Trailing Dividend Yield %. All Rel Sector Rel Country Forward Dividend Yield %. Quantitative Moat Narrow 99 98 97 Price/Earnings Valuation Overvalued 3 4 7 Price/Revenue Quantitative Uncertainty Medium 99 98 94 Morningstar RatingQ. Financial Health Strong 89 88 80 QQQQQ. QQQQ. QQQ. VIS QQ. s ESP Q. 2013 2014 2015 2016 2017 TTM Financials (Fiscal Year in K). Undervalued Fairly Valued Overvalued 765,337 687,063 740,770 730,833 778,136 773,529 Revenue Source: Morningstar Equity Research % Change 129,868 136,629 161,201 149,286 154,740 144,941 Operating Income % Change Valuation Sector Country Current 5-Yr Avg Median Median 101,520 106,452 120,022 125,084 122,101 121,648 Net Income Price/Quant Fair Value 123,783 118,315 137,698 140,519 157,288 124,007 Operating Cash Flow Price/Earnings -97,793 -60,074 -56,702 -80,747 -111,561 -94,608 Capital Spending Forward P/E 25,990 58,241 80,996 59,772 45,727 29,399 Free Cash Flow Price/Cash Flow % Sales Price/Free Cash Flow EPS.
4 Trailing Dividend Yield % % Change Price/Book Free Cash Flow/Share Price/Sales Dividends/Share Book Value/Share Profitability Sector Country 46,604 46,604 46,604 46,604 46,604 46,604 Shares Outstanding (K). Current 5-Yr Avg Median Median Return on Equity % Profitability Return on Equity %. Return on Assets % Revenue/Employee (K) Return on Assets %. Net Margin %. Financial Health Asset Turnover Sector Country Current 5-Yr Avg Median Median Financial Leverage Distance to Default Gross Margin %. Solvency Score Operating Margin %. Assets/Equity 46,763 43,513 36,802 54,574 74,302 11,978 Long-Term Debt Long-Term Debt/Equity 521,617 575,867 632,909 707,864 727,546 733,751 Total Equity Fixed Asset Turns Growth Per Share Quarterly Revenue & EPS Revenue Growth Year On Year %.
5 1-Year 3-Year 5-Year 10-Year Revenue (Mil) Mar Jun Sep Dec Total Revenue % 2018 . Operating Income % 2017 Earnings % 2016 Dividends % 2015 Book Value % Earnings Per Share (). Stock Total Return % 2018 . 2017 2016 2016 2017 2018. 2015 Morningstar 2018. All Rights Reserved. Unless otherwise provided in a separate agreement, you may use this report only in the country in which its original distributor is based. The information, data, analyses and . opinions presented herein do not constitute investment advice; are provided solely for informational purposes and therefore is not an offer to buy or sell a security; are not warranted to be correct, complete or accurate; and are subject to change without notice. Except as otherwise required by law, Morningstar shall not be responsible for any trading decisions, damages or other losses resulting from, or related to, the information, data.
6 Analyses or opinions or their use. The information herein may not be reproduced, in any manner without the prior written consent of Morningstar. Please see important disclosures at the end of this report. Quantitative Equity Report | Release: 10 Aug 2018, 23:01 UTC | Reporting Currency: EUR | Trading Currency: EUR | Exchange:XMAD Page 2 of 4. Log (Quant FVE/Price) between ( *Quantitative Uncertainty, 1*Quantitative Quantitative Equity Reports Overview Uncertainty). Five-Star the stock is undervalued with a reasonable margin of safety. Log (Quant FVE/Price) > 1*Quantitative Uncertainty The quantitative report on equities consists of data, statistics and quantitative iv. Quantitative Uncertainty: Intended to represent Morningstar's level of equity ratings on equity securities.
7 Morningstar, Inc.'s quantitative equity uncertainty about the accuracy of the Quantitative Fair Value Estimate. ratings are forward looking and are generated by a statistical model that is Generally, the lower the Quantitative Uncertainty, the narrower the potential based on Morningstar Inc.'s analyst-driven equity ratings and quantitative range of outcomes for that particular company. The rating is expressed as Low, statistics. Given the nature of the quantitative report and the quantitative Medium, High, Very High, and Extreme. ratings, there is no one analyst in which a given report is attributed to; however, Low the interquartile range for possible fair values is less than 10%. Mr. Lee Davidson, Head of Quantitative Research for Morningstar, Inc.
8 , is Medium the interquartile range for possible fair values is less than 15%. responsible for overseeing the methodology that supports the quantitative but greater than 10%. equity ratings used in this report. As an employee of Morningstar, Inc., Mr. High the interquartile range for possible fair values is less than 35% but Davidson is guided by Morningstar, Inc.'s Code of Ethics and Personal Securities greater than 15%. Trading Policy in carrying out his responsibilities. Very High the interquartile range for possible fair values is less than 80%. but greater than 35%. Extreme the interquartile range for possible fair values is greater than Quantitative Equity Ratings 80%. Morningstar's quantitative equity ratings consist of: (i) Quantitative Fair Value Estimate, (ii) Quantitative Star Rating, (iii) Quantitative Uncertainty, (iv).
9 Quantitative Economic Moat, and (v) Quantitative Financial Health (collectively v. Quantitative Financial Health: Intended to reflect the probability that a the Quantitative Ratings). firm will face financial distress in the near future. The calculation uses a predictive model designed to anticipate when a company may default on its financial obligations. The rating is expressed as Weak, Moderate, and Strong. The Quantitative Ratings are calculated daily and derived from the analyst- Weak assigned when Quantitative Financial Health < driven ratings of a company's peers as determined by statistical algorithms. Moderate assigned when Quantitative Financial Health is between Morningstar, Inc. ( Morningstar , we , our ) calculates Quantitative Ratings and for companies whether or not it already provides analyst ratings and qualitative Strong assigned when Quantitative Financial Health > coverage.
10 In some cases, the Quantitative Ratings may differ from the analyst ratings because a company's analyst-driven ratings can significantly differ from other companies in its peer group. Other Definitions i. Last Close Price of the stock as of the close of the market of the last trading day before date of the report. i. Quantitative Fair Value Estimate: Intended to represent Morningstar's estimate of the per share dollar amount that a company's equity is worth today. Morningstar calculates the Quantitative Fair Value Estimate using a statistical ii. Quantitative Valuation Using the below terms, intended to denote the model derived from the Fair Value Estimate Morningstar's equity analysts relationship between the security's Last Price and Morningstar's quantitative assign to companies.