Transcription of Viscosity: A lubricant’s most important characteristic
1 viscosity : A lubricant's most important characteristic Introduction For any oil lubrication system, oil viscosity is considered as the most important parameter. One should always ensure that the viscosity of the oil in use meets OEM recommendations. The main function of a lubrication oil is to create and maintain a lubrication film between two moving metal surfaces and this function is very much dependant on the viscosity of the oil itself. Figure 1 illustrates the gap between two metal surfaces moving in opposite directions, separated by a layer of lubricant. Figure 1: Lubrication film for two moving surfaces. Often, when the oil viscosity is not within specified viscosity range, a condition known as insufficient lubrication will occur, resulting in increased friction, wear and heat. Figure 2 and 3 shows the result of insufficient lubrication on inner race and rollers of a bearing, resulting in catastrophic failure. Figure 2: Damaged inner ring of a Figure 3: Damaged bearing rollers spherical roller bearing caused by caused by insufficient lubricant.
2 Insufficient lubricant. Failures such as this may be prevented if abnormal viscosity is detected early and the fault is corrected. viscosity is one of the compulsory tests for routine in-service oil analysis. Any significant change detected in the measured viscosity requires prompt action and could be indicative of severe degradation of oil, cross contamination, water ingression or other factors that can be confirmed by measuring other parameters ( water content). What is viscosity viscosity can be defined as measurement of fluid internal resistance to flow at a specified temperature. There are two ways to measure a fluid's viscosity , namely Dynamic (Absolute) viscosity and Kinematic viscosity . Dynamic (Absolute) viscosity Dynamic viscosity is defined as a fluid's resistance to flow, or the fluid's resistance to deform when subjected to a force1. An easy way to visualise this is to imagine stirring two liquids, water and honey, in two separate containers. The honey provides more resistance to shear forces through the stirring process compared to water, and is said to have higher dynamic viscosity compared to water.
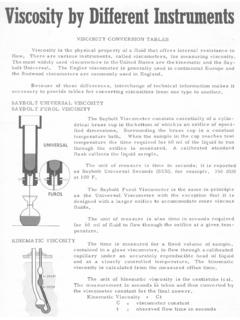
3 Dynamic viscosity is commonly reported in Centipoise (cP). 1 cP = Brookfield rotary method ASTM D2893 is the most common method to measure dynamic viscosity as shown in Figure 4. Figure 4: Brookfield rotary method ASTM D2893. Kinematic viscosity Kinematic viscosity , defined as a fluid's resistance to flow, is traditionally measured by noting the time taken for a fluid sample to travel through an orifice in a capillary under the force of gravity (Figure 5)2. This method is defined by ASTM D445 and currently used by most laboratories worldwide. The time taken is noted and converted into Kinematic viscosity , reported in Centistoke units (cSt). 1 cSt = 1 mm2/s. Figure 5: Method for Kinematic viscosity Figure 6: Automatic Kinematic Viscometer It is important to note that most laboratories report viscosity as Kinematic viscosity , whilst most on- site equipment reports in Dynamic viscosity units. However, both Dynamic and Kinematic viscosity are interchangeable by using the formula below: Dynamic viscosity (cP) = Kinematic viscosity (cSt) x Fluid Density (kg/m3).
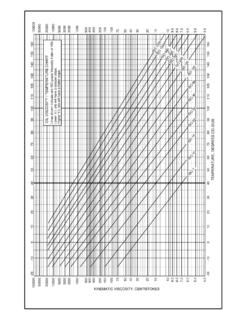
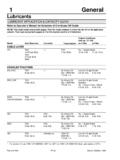
4 Oil viscosity Grade lubricants are classified according to their viscosity at 40 C by authorised bodies such as the International Organisation for Standardisation (ISO), American Gear Manufacturer Association (AGMA), Society of Automotive Engineers (SAE) etc. Figure 7 shows the classification of oil based on viscosity . Figure 7. It is important to note that the viscosity of a lubricant will decrease as the temperature increases. viscosity Index (VI) is an arbitrary scalar value that indicates the change in an oil's viscosity with changes in its temperature. A high viscosity Index indicates less viscosity change when temperature increases, indicating better resistance to thinning, for a given oil and, likely better film strength retention under heat duress. Figure 8: Comparison between viscosity change of two oils against temperature Based on Figure 8, Oil A has higher viscosity Index compared to Oil B. Can we measure oil viscosity on-site? There are several methods to measure viscosity on-site.
5 1. viscosity comparator viscostick The low cost, entry level of viscosity measurement. New and in-service oil is put into the viscostick and tilted to allow both oils to flow down the channels. By comparing the distance that the two oils flow, the result is either more viscous or less viscous than the reference oil. However, the result is not specified in quantitative units. If the in-service oil viscosity is outside acceptable range, typically a 10% difference to the reference oil, this is indicative of a change in viscosity . For more subtle differences, a quantitative measurement would be needed. Figure 9: Viscostick 2. Viscotube Figure 10: Viscotube A Viscotube uses falling ball technique to measure the viscosity of oil. Kittiwake's DIGI Viscotube uses this method to measure oil viscosity between 20-6000 cSt @ 40 C. The time taken by the ball to fall inside a tube filled with an oil sample due to gravity force is noted. The data is inputted into the supplied viscosity calculation software together with oil temperature, viscosity Index and density.
6 The viscosity calculation software automatically calculates the kinematic viscosity of an oil sample at room temperature, 40 C, 50 C and 100 C (Figure 11). Figure 11: Kittiwake viscosity calculation software 3. Viscometer Figure 12: Kittiwake Heated Viscometer Figure 13: Kittiwake Unheated Viscometer Viscometers designed and produced by Parker Kittiwake are currently among the most accurate on- site instruments to measure viscosity and correlate strongly to laboratory measurements. Two versions are available, heated and unheated. With the heated version, the oil sample inside the viscometer is heated to 40 C. After the viscometer is tilted, the ball inside the viscometer will drop due to gravitational force. The time taken by the ball will be detected and calculated into oil kinematic viscosity in cSt automatically. For the unheated version, the ball travel time is measured at room temperature, calculated and corrected to kinematic viscosity at 40 automatically. Both Heated and Unheated viscometers can calculate the kinematic viscosity at 100 C by inserting the oil viscosity Index value.
7 For engine oil, both devices are able to display the oil viscosity according to its SAE Grade. The viscosity range for the unheated version is between 20 and 810 cSt at 40 C and for the heated version, between 20 and 810 cSt at 40 C. Why oil viscosity monitoring is very important ? most components surfaces are separated by a lubrication film thickness of 10 micron or less. Especially for high pressure systems, such as hydraulics or high speed turbochargers, to maintain the correct oil viscosity is even more critical. Any significant change of oil viscosity , either a reduction or increment, may damage lubrication film stability and effectiveness. The results can be summarised as Table 1: Reduction in viscosity Increase in viscosity Loss of oil film resulting in excessive wear Excessive heat generation resulting in oil oxidation, sludge and varnish build-up Increased mechanical friction causing excessive energy consumption and heat generation Gaseous cavitation due to inadequate oil flow to pumps and bearings Increased sensitivity to particle contamination due to reduced oil film thickness Lubrication starvation due to inadequate oil flow Oil film failure at high temperatures, high loads during Oil whip in journal bearings start-ups or coast-downs Excess energy consumption to overcome fluid friction Poor air detrainment or demulsibility Poor cold start pumpability.
8 Table 1: Effect of significant oil viscosity increase and reduction 3. The end results of above effects are shorter oil lifespan, shorter components lifecycle, increased oil consumption, higher power consumption and reduced machine reliability. It is extremely important for the end user to find the root cause of oil viscosity change and to act accordingly at the earliest possible time to minimise the damage. Root causes are listed in Table 2: Reduction in viscosity Increase in viscosity Thermal cracking of oil molecules Oxidation Shear thinning of VI improvers (for multigrade Water (emulsion). engine oil). Formation of carbon and oxides insoluble Fuel dilution Soot Cross mixing with lower viscosity oil Antifreeze (Glycol). Cross mixing with higher viscosity oil Table 2: Root cause of viscosity change most of the factors, except water ingression, may be rectified by changing the oil. However, further analysis is required to confirm the root cause before any actions are taken. Once the root cause(s) is / are confirmed, remedial action should be taken to prevent the incident from recurring, especially if contamination is identified.
9 It is important to note that sometimes two factors may be acting in opposite directions, resulting in an acceptable viscosity range, for example soot (increases viscosity ) and fuel dilution (reduces viscosity ) for engine oil. Both factors can be measured separately and if either of them exceed acceptable limits, this may be detrimental to the machine. Hence, viscosity analysis alone is not comprehensive. How to set the viscosity limit for in-service oil The first step is to set a baseline value as a reference. This value is based on actual viscosity measurement of new fresh oil and not from the lubricant product sheet. Industrial oil (hydraulic, turbine, compressor, gear etc) should be based on kinematic viscosity @ 40 C, whilst for engine oil, kinematic viscosity @ 100 C should be used. The upper limits and lower limits for in-service oil should be based on this value. Noria recommendations set the limits (in percentages) as per Table 3. Limit Crankcase Oils** Industrial Oils** Severe Environment Industrial Oils**.
10 Critical (upper) +20% +10% +7%. Caution (upper) +10% +5% +4%. Caution (lower) -5% -5%* -5%*. Critical (lower) -10% -10%* -10%*. * Twice this amount for oils with VI improvers. **Crankcase oil limits based on cSt @ 100 C, industrial oils based on cSt @ 40 C. Note: Severe environment oils are at a higher risk of thermal and oxidative degradation. Table 3: Limitation for in-service oil viscosity 4. Once the baseline and limits have been set, routine viscosity can be analysed by trending. Figure 14. shows one example of viscosity trend. It is important to note that small fluctuation in the measured value is normal, for example after every top off activity. However, any significant change above the limits requires an investigation. Figure 14: Example of viscosity trend analysis Figure 15 shows a chart of how viscosity monitoring should be performed, as well as the potential investigation required. Figure 15: viscosity analysis and further action 4. Case Study Gearbox for Ship Loading Conveyor Prior to December 2003, the gearbox was filled with ISO VG 150 Gear Oil, against the OEM.