Transcription of Visual Mining of Cluster Hierarchies - LMU Munich
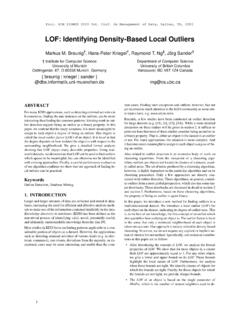
1 Visual Mining of Cluster HierarchiesHans-Peter Kriegel, Stefan Brecheisen, Eshref Januzaj, Peer Kr ger, Martin PfeifleUniversity of Munich , Institute for Computer {kriegel, brecheia, januzaj,kroegerp, Similarity search in database systems is becoming an increasingly im-portant task in modern application domains such as multimedia, molecular biology,medical imaging, computer aided engineering, marketing and purchasing assist-ance as well as many others. In this paper, we show how visualizing the hierarchi-cal clustering structure of a database of objects can aid the user in his timeconsuming task to find similar objects. We present related work and explain itsshortcomings which led to the development of our new methods. Based on reach-ability plots, we introduce approaches which automatically extract the significantclusters in a hierarchical Cluster representation along with suitable Cluster repre-sentatives.}
2 These techniques can be used as a basis for Visual data Mining . We im-plemented our algorithms resulting in an industrial prototype which we used for theexperimental evaluation. This evaluation is based on real world test data sets andpoints out that our new approaches to automatic Cluster recognition and extractionof Cluster representatives create meaningful and useful results in comparativelyshort the last ten years, an increasing number of database applications has emerged forwhich efficient and effective support for similarity search is substantial. The importanceof similarity search grows in application areas such as multi-media, medical imaging,molecular biology, computer aided engineering, marketing and purchasing assistance,etc. [10], [1],[8],[9],[2],[5],[6],[11].Particularl y, the task of finding similar shapes in 2-D and 3-D becomes more and moreimportant.
3 Examples for new applications that require the retrieval of similar 3D objectsinclude databases for molecular biology, medical imaging and computer aided design. Hierarchical clustering was shown to be effective for evaluating similarity models[12],[13]. Especially, the reachability plot generated by OPTICS [4] is suitable for assess-ing the quality of a similarity model. Furthermore, visually analyzing Cluster hierarchieshelps the user, an engineer, to find and group similar objects. Solid Cluster extractionand meaningful Cluster representatives form the foundation for providing the user withsignificant and quick this paper, we introduce algorithms for automatically detecting hierarchical clustersalong with their corresponding representatives. In order to evaluate our ideas, we devel-oped a prototype called BOSS (Browsing OPTICS-Plots for Similarity Search).
4 BOSS isbased on techniques related to Visual data Mining . It helps to visually analyze Cluster hi-erarchies by providing meaningful Cluster remainder of the paper is organized as follows: After briefly introducing reacha-bility plots, we present in Section 2 the application areas of hierarchical clustering alongwith the corresponding requirements in the industrial and in the scientific communitywhich motivated the development of BOSS. In Sections 3 and 4, we introduce the notionsof Cluster recognition and Cluster representatives respectively, which form the theoreticalfoundations of BOSS. In Section 5, we describe the actual industrial prototype we devel-oped and evaluate its usefulness in Section 6. The paper concludes in Section 7 with ashort summary and a few remarks on future Clustering In this section, we outline the application ranges which led to the development of ourinteractive browsing tool, called BOSS.
5 In order to understand the connection betweenBOSS and the application requirements we first introduce the reachability plots comput-ed by OPTICS, which served as a starting point for BOSS. The technical aspects relatedto BOSS are described later in Section Reachability PlotsThe key idea of density-based clustering is that for each object of a Cluster the neigh-borhood of a given radius has to contain at least a minimum number MinPts of the density-based hierarchical clustering algorithm OPTICS yields several advan-tages due to the following reasons. OPTICS is -in contrast to most other algorithms- relatively insensitive to its twoinput parameters, and MinPts. The authors in [4] state that the input parametersjust have to be large enough to produce good results. OPTICS is a hierarchical clustering method which yields more information about thecluster structure than a method that computes a flat partitioning of the data ( k-means [15]).
6 There exist a very efficient variant of the OPTICS algorithm which is based on databubbles [7], where we have to trade only very little quality of the clustering result fora great increase in performance. There exist an efficient incremental version of the OPTICS algorithm [13].The reachability plots computed by OPTICS help the user to get a meaningful andquick overview over a large data set. The output of OPTICS is a linear ordering of thedatabase objects minimizing a binary relation called reachability which is in most casesequal to the minimum distance of each database object to one of its predecessors in theordering. Instead of a dendrogram, which is the common representation of hierarchicalclusterings, the resulting reachability plot is much easier to analyse. The reachability val-ues can be plotted for each object of the Cluster -ordering computed by OPTICS.
7 Valleysin this plot indicate clusters: objects having a small reachability value are closer and thusmore similar to their predecessor objects than objects having a higher reachability reachability plot generated by OPTICS can be cut at any level cut parallel to theabscissa. It represents the density-based clusters according to the density threshold cut:A consecutive subsequence of objects having a smaller reachability value than cut be-longs to the same Cluster . An example is presented in Figure 1: For a cut at the level 1we find two clusters denoted as A and B. Compared to this clustering, a cut at level 2would yield three clusters. The Cluster A is split into two smaller clusters denoted by A1and A2 and Cluster B decreased its size. Usually, for evaluation purposes, a good valuefor cut would yield as many clusters as Ranges.
8 BOSS was designed for three different purposes: Visual data min-ing, similarity search and evaluation of similarity models. For the first two applications,the choice of the representative objects of a Cluster is the key step. It helps the user to geta meaningful and quick overview over a large existing data set. Furthermore, BOSS helpsscientists to evaluate new similarity data Mining . As defined in [3], Visual data Mining is a step in the KDD processthat utilizes visualization as a communication channel between the computer and the userto produce novel and interpretable patterns. Based on the balance and sequence of the au-tomatic and the interactive ( Visual ) part of the KDD process, three classes of Visual datamining can be identified. Visualization of the data Mining result:An algorithm extracts patterns from the data .
9 These patterns are visualized to makethem interpretable. Based on the visualization, the user may want to return to the datamining algorithm and run it again with different input parameters (cf. Figure 2a). Visualization of an intermediate result:An algorithm performs an analysis of the data not producing the final patterns but anintermediate result which can be visualized. Then the user retrieves the interestingpatterns in the visualization of the intermediate result (cf. Figure 2b). Visualization of the data : data is visualized immediately without running a sophisticated algorithm before. Pat-terns are obtained by the user by exploring the visualized data (cf. Figure 2c).The approach presented in this paper belongs to the second class. A hierarchical clus-tering algorithm is applied to the data , which extracts the clustering structure as an inter-mediate result.
10 There is no meaning associated with the generated clusters. However, ourapproach allows the user to visually analyze the contents of the clusters. The clusteringalgorithm used in the algorithmic part is independent from an application. It performs the : Reachability plots computed by optics (right) for a 2D dataset (left)core part of the data Mining process and its result serves as a multi-purpose basis for fur-ther analysis directed by the user. This way the user may obtain novel information whichwas not even known to exist in the data set. This is in contrast to similarity search wherethe user is restricted to find similar parts respective to a query object and a predeterminedsimilarity Search. The development, design, manufacturing and maintenance of mod-ern engineering products is a very expensive and complex task.