Transcription of Visualizing the Loss Landscape of Neural Nets
1 Visualizing the loss Landscape of Neural NetsHao Li1, Zheng Xu1, Gavin Taylor2, Christoph Studer3, Tom Goldstein11 University of Maryland, College Park2 United States Naval Academy3 Cornell network training relies on our ability to find good minimizers of highlynon-convex loss functions. It is well-known that certain network architecturedesigns ( , skip connections) produce loss functions that train easier, and well-chosen training parameters (batch size, learning rate, optimizer) produce minimiz-ers that generalize better. However, the reasons for these differences, and theireffect on the underlying loss Landscape , are not well understood. In this paper, weexplore the structure of Neural loss functions, and the effect of loss landscapes ongeneralization, using a range of visualization methods. First, we introduce a simple filter normalization method that helps us visualize loss function curvature andmake meaningful side-by-side comparisons between loss functions.
2 Then, usinga variety of visualizations, we explore how network architecture affects the losslandscape, and how training parameters affect the shape of IntroductionTraining Neural networks requires minimizing a high-dimensional non-convex loss function atask that is hard in theory , but sometimes easy in practice. Despite the NP-hardness of traininggeneral Neural loss functions [3], simple gradient methods often find global minimizers (parameterconfigurations with zero or near-zero training loss ), even when data and labels are randomized beforetraining [43]. However, this good behavior is not universal; the trainability of Neural nets is highlydependent on network architecture design choices, the choice of optimizer, variable initialization, anda variety of other considerations. Unfortunately, the effect of each of these choices on the structure ofthe underlying loss surface is unclear.
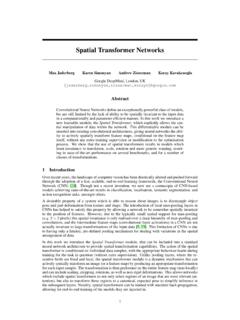
3 Because of the prohibitive cost of loss function evaluations(which requires looping over all the data points in the training set), studies in this field have remainedpredominantly theoretical.(a) without skip connections(b) with skip connectionsFigure 1: The loss surfaces of ResNet-56 with/without skip connections. The proposed filternormalization scheme is used to enable comparisons of sharpness/flatness between the two Conference on Neural Information Processing Systems (NeurIPS 2018), Montr al, have the potential to help us answer several important questions about why neuralnetworks work. In particular, why are we able to minimize highly non-convex Neural loss functions?And why do the resulting minima generalize? To clarify these questions, we use high-resolutionvisualizations to provide an empirical characterization of Neural loss functions, and explore howdifferent network architecture choices affect the loss Landscape .
4 Furthermore, we explore how thenon-convex structure of Neural loss functions relates to their trainability, and how the geometryof Neural minimizers ( , their sharpness/flatness, and their surrounding Landscape ), affects theirgeneralization do this in a meaningful way, we propose a simple filter normalization scheme that enables us todo side-by-side comparisons of different minima found during training. We then use visualizations toexplore sharpness/flatness of minimizers found by different methods, as well as the effect of networkarchitecture choices (use of skip connections, number of filters, network depth) on the loss goal is to understand how loss function geometry affects generalization in Neural ContributionsWe study methods for producing meaningful loss function visualizations. Then, using these visualiza-tion methods, we explore how loss Landscape geometry affects generalization error and specifically, we address the following issues: We reveal faults in a number of visualization methods for loss functions, and show thatsimple visualization strategies fail to accurately capture the local geometry (sharpness orflatness) of loss function minimizers.
5 We present a simple visualization method based on filter normalization. The sharpness ofminimizers correlates well with generalization error when this normalization is used, evenwhen making comparisons across disparate network architectures and training enables side-by-side comparisons of different minimizers1. We observe that, when networks become sufficiently deep, Neural loss landscapes quicklytransition from being nearly convex to being highly chaotic. This transition from convex tochaotic behavior coincides with a dramatic drop in generalization error, and ultimately to alack of trainability. We observe that skip connections promote flat minimizers and prevent the transition tochaotic behavior, which helps explain why skip connections are necessary for trainingextremely deep networks. We quantitatively measure non-convexity by calculating the smallest (most negative) eigen-values of the Hessian around local minima, and Visualizing the results as a heat map.
6 We study the visualization of SGD optimization trajectories (Appendix B). We explainthe difficulties that arise when Visualizing these trajectories, and show that optimizationtrajectories lie in an extremely low dimensional space. This low dimensionality can beexplained by the presence of large, nearly convex regions in the loss Landscape , such asthose observed in our 2-dimensional Theoretical BackgroundNumerous theoretical studies have been done on our ability to optimize Neural loss function [6,5].Theoretical results usually make restrictive assumptions about the sample distributions, non-linearityof the architecture, or loss functions [17,32,41,37,10,40]. For restricted network classes, suchas those with a single hidden layer, globally optimal or near-optimal solutions can be found bycommon optimization methods [36,27,39]. For networks with specific structures, there likely existsa monotonically decreasing path from an initialization to a global minimum [33,16].
7 Swirszcz et al.[38] show counterexamples that achieve bad local minima for toy works have addressed the relationship between sharpness/flatness of local minima and theirgeneralization ability. Hochreiter and Schmidhuber[19]defined flatness as the size of the connectedregion around the minimum where the training loss remains low. Keskar et al.[25]characterize1 Code and plots are available using eigenvalues of the Hessian, and propose -sharpness as an approximation, which looksat the maximum loss in a neighborhood of a minimum. Dinh et al.[8], Neyshabur et al.[31]showthat these quantitative measure of sharpness are not invariant to symmetries in the network, and arethus not sufficient to determine generalization ability. Chaudhari et al.[4]used local entropy as ameasure of sharpness, which is invariant to the simple transformation in [8], but difficult to accuratelycompute.
8 Dziugaite and Roy [9] connect sharpness to PAC-Bayes bounds for The Basics of loss Function VisualizationNeural networks are trained on a corpus of feature vectors ( , images){xi}and accompanyinglabels{yi}by minimizing a loss of the formL( )=1mPmi=1`(xi,yi; ), where denotes theparameters (weights) of the Neural network, the function`(xi,yi; )measures how well the neuralnetwork with parameters predicts the label of a data sample, andmis the number of data nets contain many parameters, and so their loss functions live in a very high-dimensionalspace. Unfortunately, visualizations are only possible using low-dimensional 1D (line) or 2D (surface)plots. Several methods exist for closing this dimensionality Linear InterpolationOne simple and lightweight way to plot loss functions isto choose two parameter vectors and 0,and plot the values of the loss function along the lineconnecting these two points.
9 We can parameterize this line by choosing a scalar parameter ,anddefining the weighted average ( )=(1 ) + , we plot the functionf( )=L( ( )).This strategy was taken by Goodfellow et al.[14], who studied the loss surface along the line betweena random initial guess, and a nearby minimizer obtained by stochastic gradient descent. This methodhas been widely used to study the sharpness and flatness of different minima, and the dependenceof sharpness on batch-size [25,8]. Smith and Topin[35]use the same technique to show differentminima and the peaks between them, while Im et al.[22]plot the line between minima obtainedvia different 1D linear interpolation method suffers from several weaknesses. First, it is difficult to visualizenon-convexities using 1D plots. Indeed, Goodfellow et al.[14]found that loss functions appearto lack local minima along the minimization trajectory.
10 We will see later, using 2D methods, thatsome loss functions have extreme non-convexities, and that these non-convexities correlate with thedifference in generalization between different network architectures. Second, this method does notconsider batch normalization [23] or invariance symmetries in the network. For this reason, the visualsharpness comparisons produced by 1D interpolation plots may be misleading; this issue will beexplored in depth in Section Plots & Random DirectionsTo use this approach, one chooses a center point inthe graph, and chooses two direction vectors, and . One then plots a function of the formf( )=L( + )in the 1D (line) case, orf( , )=L( + + )(1)in the 2D (surface) case2. This approach was used in [14] to explore the trajectories of differentminimization methods. It was also used in [22] to show that different optimization algorithms finddifferent local minima within the 2D projected space.