Transcription of VOLUME XX ISSUE No. 2 July 2017 - Home | Food …
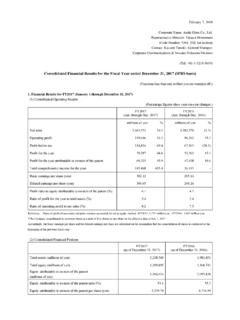
1 VOLUME XX ISSUE No. 2 july 2017 37039842645448251020601001401802007-0820 08-092009-102010-112011-122012-132013-14 2014-152015-162016-172017-18 Closing Stocks (left axis)Utilization (right axis)Production (right axis)Million tonnes, milled tonnes, milled 'castRiceproduction, utilization and stocks ROUND UP By now, countries located along and south of the Equator have already collected their 2017 main crops, with a few countries now engaged in offseason cropping activities. The 2017 season is less advanced in the northern hemisphere, where producers have just put their main-crops in the ground or are still busy doing so.
2 At million tonnes ( million tonnes, milled basis), FAO s latest forecast of global paddy production in 2017 is little varied from April expectations, despite a number of significant revisions at a country level. In particular, adverse weather conditions called for downward adjustments to production prospects for Bangladesh, China (Mainland), Sri Lanka, the United States and Viet Nam, although most of these changes were offset by improvements for Brazil, Cambodia, Egypt, India, and Myanmar. At million tonnes ( million tonnes, milled basis), world paddy production in 2017 would stand percent, or million tonnes, above a revised estimate for 2016 .
3 The comparatively modest year-on-year increase mirrors constraints posed by tight margins and heightened competition with other crops, which could entail a slow-down in the rate of area expansions. Still, the season is unfolding under generally favourable weather conditions. This is namely the case in Asia, where, with a few notable exceptions, conducive rains have aided cropping activities. Provided weather conditions hold, the continent is expected to gather percent more than the record of 2016 , or million tonnes. Much of the region s production growth is envisaged to take place in India and Indonesia, owing to continued government support, and in Thailand thanks to prospects of improved margins.
4 In addition, Cambodia, China (Mainland), the Islamic Republic of Iran, Iraq, the Lao People's Democratic Republic, Malaysia, Myanmar, Nepal, Pakistan, the Philippines and Turkey are all foreseen to gather more in 2017 . Weather vagaries could instead keep production in both Bangladesh and Viet Nam close to 2016 reduced levels, while output is expected to fall in Afghanistan, the Republic of Korea and, especially, Sri Lanka. In Africa, paddy production in 2017 is now predicted to reach million tonnes, up slightly from the 2016 excellent harvest. Continued production expansions in West Africa are likely to sustain the feat, with positive results in Ghana, Guinea, Mali, Nigeria and Senegal often GLOBAL RICE MARKET SUMMARY 2015-16 2016 -17 2017 -18 2017 -18/ 2016 -17 est.
5 F'cast var. million tonnes, milled eq. % Production Supply Utilization Food use Feed use Other uses Trade 1/ Ending stocks 2/ % Global stock-to -use ratio - Major exporters' stock-to-disappearance ratio 3/ - 1/ Data refer to the calendar year trade ( ) of the second year shown. 2/ Stocks carried over in the second year shown. 3/ Defined as the sum of the five major rice exporters (India, Pakistan, Thailand, the United States and Viet Nam) stocks divided by the sum of their domestic utilization plus exports. Production 1 International Trade 10 Rice Utilization and Domestic Prices 15 Closing Stocks 18 International Prices 19 Rice Policy Developments 23 FAO RICE MARKET MONITOR / july 2017 ROUND UP Information Update as of 14 july 2017 facilitated by state support under programs pursuing self-sufficiency in rice.
6 Nonetheless, more buoyant yield prospects have also boosted the outlook for Egypt, where plantings proved more resilient than last envisaged. Gains in these countries would more than compensate for shortfalls in eastern and southern Africa. This would be namely the case of the United Republic of Tanzania and Madagascar, where crops were exposed to unseasonable dryness, with additional losses inflicted by cyclone Enawo in Madagascar. In Latin America and the Caribbean, favourable growing conditions are expected to foster a 6 percent production recovery in 2017 to million tonnes.
7 Brazil is set to account for much of this upturn, although Cuba, the Dominican Republic, Ecuador, Guyana, Nicaragua and Uruguay are all heading towards larger crops. Instead, inclement weather is behind expected contractions in Chile and Peru, with tight margins also driving reductions in Argentina, Bolivia and Colombia. In the other regions, the outlook is negative for the United States and Europe, where area cuts induced by subdued prices have been recently compounded by poor weather. Instead, output is assessed to have reached a four-year high in Australia, as ample and more affordable water availabilities sustained a rebound in plantings.
8 International rice trade in calendar 2017 is now forecast to exceed the 2016 depressed level by 7 percent to million tonnes, which is 930 000 tonnes more than predicted in April. The forecast growth is expected to be demand-driven and concentrate in Asia, where important buyers have turned to imports to rebuild inventories and/or quell upward pressure on domestic prices. Within the region, sizeable import increases are envisaged to concern Bangladesh, the Philippines and Sri Lanka, although China (Mainland), the Islamic Republic of Iran, Iraq, Malaysia and Saudi Arabia are also set to purchase more from abroad.
9 These gains would more than compensate for cuts elsewhere, with the largest reduction set to concern Indonesia. Al beit more moderately, African countries are also seen raising imports, led by gains in Nigeria, Madagascar, but also Liberia, Senegal and Sierra Leone. Instead, ample local availabilities may cause demand to wane in Latin America and the Caribbean, Europe and the United States. On the export side, India, Thailand and Viet Nam remain forecast to capture much of the expected trade growth this year, although affordable prices are similarly envisaged to translate into strong export performances by China (Mainland) and Myanmar.
10 Australia, Paraguay, the United States and Uruguay are also envisaged to count on sufficient availabilities to lift exports in 2017 . By contrast, in the aftermath of output shortfalls or heightened competition, Argentina, Brazil, Pakistan and the Russian Federation are seen shipping less, while continued export restrictions lower deliveries by Egypt. Despite a 700 000 tonne downward adjustment since April, global rice utilization is forecast to grow by percent in 2017 /18 to million tonnes (milled basis). All of this increase would be attributable to a percent expansion in food use to million tonnes.