Transcription of Voluntary Carbon Market 2021 in Review and 2022 Outlook
1 Trove Research Ltd. -ConfidentialPublication date: 31 January 2022 Voluntary Carbon Market2021 in Review and 2022 Outlook01/02/2022 Trove Research Limited 20212 The Trove Intelligence platform provides a comprehensive source of data, analytics and research on corporate climate commitments and Voluntary Carbon creditsWeekly / monthly reportsResearch notesPowerPoint chartsExcel downloadsAccess to analysts $Trove Intelligence is the data and analytics platform of Trove ResearchCorporate climate commitments & Carbon credit demand Database of 1000 s of corporate climate commitments: SBTs, Net Zero, Carbon /Climate Neutral. Historic & forecast emissions: Scope 1, 2, and 3. Voluntary Carbon credit demand Credit Prices Weekly / monthly Carbon price indices by transaction type Forecast Carbon credit pricesPolicy landscape Guidance for corporates on setting Carbon emission, Net Zero and Carbon Neutral targets. Mapping of 100+ organisations influencing corporate climate commitments Consensus tracking, forward-looking credit projects & transactions Historic issuances by type, vintage, standard Risk metrics Compliance eligibility Forecasts 01/02/2022 Trove Research Limited 20213 SummaryThis report presents Trove Research s quarterly update on the Voluntary Carbon Market .
2 This issue contains summary charts for2021 and our forecasts for 2022. Further analysis can be found at: Carbon Market size history and 2022 Outlook ($m) Carbon Market demand 2010 to 2022 (MtCO2e) credit issuances by quarter (MtCO2e) credit retirements by quarter (MtCO2e) credit cancellations by quarter (MtCO2e) credit surplus by quarter (MtCO2e)2021 in Review : The value of the primary Voluntary Carbon Market grew by 190% in 2021 to just under $1bn. We forecast the Market will grow 50% to 80% in 2022 to between $ and $ This will be driven by more companies retiring credits for Carbon neutral claims coupled with increases in Carbon credit in Review : 4Q21 recorded the third-highest level of Carbon credit issuances in a single quarter, but issuances have fallen for the last two quarters. Retirements jumped 70% from 3Q to 4Q21 to 57Mt which was nearly a two-fold increase on 4Q20. The Market surplus reached a new peak of 559Mt in 4Q21. However, the rate of increase in the surplus has slowed over the past two quarters from 15% to 5%, and at 21Mt, 4Q21 had the smallest increase since insights01/02/2022 Trove Research Limited 202141081301582133289511,4681,6870200400 6008001,0001,2001,4001,6001,8002,0002016 201720182019202020212022 Low2022 HighCCUSNon-CO2 GasesOtherFuel SwitchEnergy EfficiencyRenewable EnergyREDD+Nature Restorationtotal1.
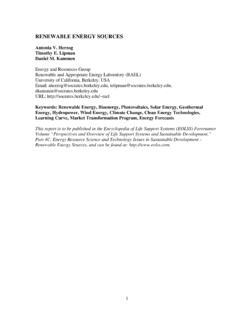
3 Voluntary Carbon Market size history and 2022 Outlook ($m)The value of the primary Voluntary Carbon Market grew by 190% in 2021 to just under $ forecast the Market will grow 50% to 80% in 2022 to between $ and $ This will be driven by more companies retiring credits for Carbon neutral claims coupled with credit price , the proportional rate of growth 2021-2022 will be less than 2020-2021. This is for two main was an abnormal year with a surge of interest in climate change, particularly around COP26, and a flurry of activity by organisations such as SBTI, TSVCM, TCFD and low prices for Voluntary Carbon credits in 2020 created a large proportional increase in 2021. We expect prices to increase in 2022, but with significant differences across credit types. Methodology note: Our short-term Market size forecasts are based on a statistical analysis of patterns in demand, supply and prices for different types of Carbon value of the primary Voluntary Carbon Market grew by 190% in 2021 to just under $1bn.
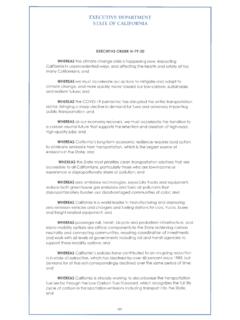
4 We expect the primary Market to grow by 50 80% in 2022 to reach $ Voluntary Carbon Market size ($m) (1)1. Excludes Carbon credits used for compliance 2022 Forecast01/02/2022 Trove Research Limited 2021571219323342334453709516102040608010 0120140160180200201020112012201320142015 201620172018201920202021 CCUSNon-CO2 GasesOtherFuel SwitchEnergy EfficiencyRenewable EnergyREDD+Nature Restoration2. Voluntary Carbon Market demand 2010 to 2021 Voluntary Carbon Market retirements grew by 70% in 2021 to 161Mt. Half of this growth came from demand for REDD+ projects, and one third from Renewable Energy 7% of the growth came from Nature Restoration credits, largely due to a lack of Carbon Market retirements grew by 70% in 2021 to 161Mt. Half of this growth came from demand for REDD+ Carbon Market Retirements (MtCO2e) (1)1. Excludes Carbon credits used for compliance 01/02/2022 Trove Research Limited 2021610211117101316331323394622272428383 14457654149677810510184020406080100Q1Q2Q 3Q4Q1Q2Q3Q4Q1Q2Q3Q4Q1Q2Q3Q4Q1Q2Q3Q4Q1Q2Q 3Q4Q1Q2Q3Q42015201620172018201920202021 Issuances by project type (MtCO2e)Non-CO2 GasesCCUSO therFuel SwitchEnergy EfficiencyRenewable EnergyREDD+Nature Restoration3.
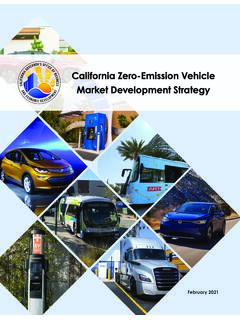
5 Carbon credit issuances by quarterQuarter in Review : 4Q214Q21 recorded the third-highest level of Carbon credit issuances in a single quarter, but issuances have fallen for the last two of all credits issued in 4Q21 came from REDD+ projects, up from 15Mt in 4Q20 to EnviraAmazonia Project in Brazil was the largest issuer of REDD+ credits in 4Q21. The issuances for this Verra registered project referred to emission reductions that occurred from 2013 through Restoration credits the only removal credits available today amounted to just 10% of last quarters in Review : 2021 Total issuances in 2021 were 368Mt, up 65% on 2020. However, issuances of Nature Restoration credits actually fellby 17% compared to Delays in reporting may result in figures for the most recent months being revised recorded the third-highest level of Carbon credit issuances in a single quarter, but issuances have fallen for the last two Trove Research Limited 2021791311910869109816141115131320132421 271531383233570102030405060Q1Q2Q3Q4Q1Q2Q 3Q4Q1Q2Q3Q4Q1Q2Q3Q4Q1Q2Q3Q4Q1Q2Q3Q4Q1Q2Q 3Q42015201620172018201920202021 Retirements by project type (MtCO2e)Non-CO2 GasesCCUSO therFuel SwitchEnergy EfficiencyRenewable EnergyREDD+Nature Restoration4.
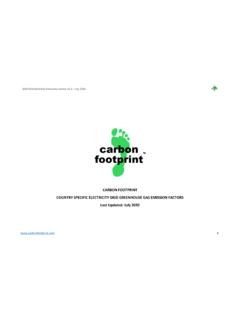
6 Carbon credit retirements by quarterQuarter in Review : 4Q21 Retirements jumped 70% from 3Q to 4Q21 to 57Mt which was nearly a two-fold increase on 4Q20. At 43% of all 4Q21 retirements, the most popular credits continued to be Renewable Energy credits. Nature Restoration credits accounted for just 7% of retirements, but at nearly 4Mt in Q42021 more Nature Restoration credits were retired in a single quarter than in the entirety of in Review : 2021 Retirements of Nature Restoration credits increased nearly two-fold year-on-year, whilst the Market as a whole recorded 69% more retirements than in 37% of all retirements, Renewable Energy credits were the most frequently retired project type in 2021. Delays in reporting may result in figures for the most recent months being revised jumped 70% from 3Q to 4Q21 to 57Mt which was nearly a two-fold increase on 4Q20. This is in contrast to issuances which fell in both 3Q and 4Q last Trove Research Limited 2021833310317721117718852311385515191291 460510152025Q1Q2Q3Q4Q1Q2Q3Q4Q1Q2Q3Q4Q1Q2 Q3Q4Q1Q2Q3Q4Q1Q2Q3Q4Q1Q2Q3Q4201520162017 2018201920202021 Credits cancelled for use in the california cap and trade scheme (MtCO2e)Non-CO2 GasesCCUSN ature Restoration5.
7 Carbon credit cancellations by quarterQuarter in Review : 4Q21 Carbon credits retired in the california cap and trade scheme remained at low levels, with just 6Mt being cancelled from the Voluntary Carbon Market in was a near 50% decrease compared to 4Q20. The primary cause was a slow down in the level of Nature Restoration credits being in Review : 2021At 17Mt, cancellations in 2021 were down 60% year-on-year -the lowest level since 2016. Cancellations from Non-CO2 Gases fared better than the rest of the Market , with cancellations for these down just 11% the Voluntary Carbon Market , the california scheme restricts the use of offsets to credits from six project types: Livestock, Mine Methane Capture, Ozone Depleting, Substances, Rice Cultivation, US Forests, and Urban Delays in reporting may result in figures for the most recent months being revised credits cancelled in the california cap and trade scheme remained at low levels in 4Q21 at just 6Mt. Q42021 Explainer: Cancellations refer to the Carbon credits used in the california cap and trade scheme for compliance purposes.
8 Entities in the scheme can use compliance offset credits to meet up to 8 percent of their compliance obligation for emissions through 2020; 4 percent of their compliance obligation for emissions from 2021-2025; and 6 percent for emissions from 2026-2030. All projects eligible for the california scheme must be from US based projects, and from 2021 onwards, at least 50% of the offsets used by an entity must be from projects that provide direct environmental benefits in the state of california . 01/02/2022 Trove Research Limited 2021916817317016916516917118918919320722 9219227231222237244266295334333349372403 4745385590100200300400500600Q1Q2Q3Q4Q1Q2 Q3Q4Q1Q2Q3Q4Q1Q2Q3Q4Q1Q2Q3Q4Q1Q2Q3Q4Q1Q2 Q3Q42015201620172018201920202021 Surplus by project type (MtCO2e)Non-CO2 GasesCCUSO therFuel SwitchEnergy EfficiencyRenewable EnergyREDD+Nature Restoration6. Carbon credit surplus by quarterQuarter in Review : 4Q21 The Market surplus reached a new peak of 559Mt in 4Q21. However, the rate of increase in the surplus has slowed over the past two quarter from 15% to 5%, and at 21Mt, 4Q21 had the smallest increase since Restoration credits recorded a slight decrease in surplus across the quarter (<1Mt).
9 Non-CO2 Gases credits were the only other project type to do so, recording a decrease of just over in Review : 2021 The surplus grew by 187Mt in 2021 and is now 147% higher than at the start of 2019 when issuances started to grow change in surplus differs by project type -REDD+ and Renewable Energy credits have seen an increase of 148Mt and 162Mt since 1Q18, representing 94% of the increase in total surplus across this timeframe. In contrast the surpluses of Nature Restoration and CCUS have both declined across the same period by 24% and 38% respectively, driven by growing demand for removal projects ( , restoration and geological sequestration) and the difficulty in supplying Delays in reporting may result in figures for the most recent months being revised Market surplus reached a new peak of 559Mt in 4Q21. However, the rate of increase in the surplus has slowed over the past two quarters from 15% to 5%Q4202101/02/2022 Trove Research Limited 202110 CopyrightThis document and its content (including, but not limited to, the text, images, graphics and illustrations) is the copyright material of Trove Research Ltd unless otherwise stated.
10 No portion of thisdocument may be photocopied, reproduced, scanned into an electronic system or transmitted, forwarded or distributed in any way without prior consent of Trove Research disclaimerThe information contained in this publication is derived from carefully selected public sources we believe are reasonable. Wedonot guarantee its accuracy or completeness and nothing in thisdocument shall be construed to be a representation of such a guarantee. Any opinions expressed reflect the current judgment of the author of the relevant article orfeatures, anddoes notnecessarily reflect the opinion of Trove Research. The opinions presented are subject to change without document contains forward-looking statements and information which reflect Trove Research s current view with respect to future events. When used in this document, the words believes , expects , plans , may , will , would , could , should , anticipates , estimates , project , intend or Outlook or other variants of these words or other similar expressionsare intended to identify forward-looking statements and information.