Transcription of Water and Wastewater Annual Price Escalation Rates for …
1 Water and Wastewater Annual Price Escalation Rates for Selected Cities across the United States September 2017 Annual Water and Wastewater Price Escalation Rates (This page intentionally left blank) Annual Water and Wastewater Price Escalation Rates i Contacts Water Efficiency Program Lead Saralyn Bunch Federal Energy Management Program Forrestal Building 1000 Independence Avenue, SW Washington, DC 20585 Phone: (202) 586-3267 E-mail: Technical Lead Katherine Cort Pacific Northwest National Laboratory 902 Battelle Blvd Richland, WA 99354 Phone: (509) 372-4374 E-mail: Principal Investigator Erica Johnson Pacific Northwest National Laboratory 902 Battelle Blvd Richland, WA 99354 Phone: (509) 372-4059 E-mail: Senior Economic Advisor Douglas Elliott Pacific Northwest National Laboratory 902 Battelle Blvd Richland, WA 99354 Phone: (509) 375-2248 E-mail: Project Manager Kate McMordie Stoughton Pacific Northwest National Laboratory 902 Battelle Blvd Richland, WA 99354 Phone: (509) 371-7258 E-mail: Annual Water and Wastewater Price Escalation Rates ii Acknowledgments PNNL would like to acknowledge the following people who provided technical and programmatic support to the production of this study.
2 Saralyn Bunch, Joseph Peterson, Eric Poehlman, Susan Loper, and Matt Wilburn. Annual Water and Wastewater Price Escalation Rates iii Abbreviations and Acronyms AWWA American Water Works Association BLS Bureau of Labor Statistics CPI Consumer Price Index DOE Department of Energy EIA Energy Information Administration FEMP Federal Energy Management Program kGal 1000 gallons LCCA life-cycle cost analysis PNNL Pacific Northwest National Laboratory Annual Water and Wastewater Price Escalation Rates iv Contents Preface .. vii 1 Introduction .. 1 2 Analysis Method .. 2 Data Source .. 2 Water and Wastewater Data Compilation.
3 2 Price Escalation Rate Derivation .. 3 Annual Price Escalation Determination .. 7 3 Analysis Results .. 9 Annual Water Price Escalation Rate Results .. 9 Annual Wastewater Price Escalation Rate Results .. 14 4 Annual Water and Wastewater Price Escalation Rates for Use in Life-Cycle Cost Analysis .. 19 References .. 21 Appendix A: Water and Wastewater Utility 22 Annual Water and Wastewater Price Escalation Rates v List of Figures Figure Map of the United States Showing the Water and Wastewater Utilities in this Study .. vii Figure 1. Water Rates for Water Utilities Included in this Study (2016$) .. 4 Figure 2. Wastewater Rates for Wastewater Utilities Included in this Study (2016$) .. 5 Figure 4.
4 Survey Sample Average Wastewater Rates over Time .. 7 Figure 5. Map of the United States Showing the Water and Wastewater Utilities in This Study .. 8 Figure 6. Map of the United States Showing the Water Utilities in This Study .. 12 Figure 7. Average Annual Water Price Escalation Rates by Region (2008-2016) .. 13 Figure 8. Average Commercial Water Rates by Region (2015) .. 14 Figure 9. Map of the United States Showing the Wastewater Utilities in This Study .. 16 Figure 10. Average Annual Wastewater Price Escalation Rates by Region (2008-2016) .. 17 Figure 11. Average Commercial Wastewater Rates by Region (2015) .. 18 Annual Water and Wastewater Price Escalation Rates vi List of Tables Table 1. AWWA 2016 Water and Wastewater Survey Customer Class Bins.
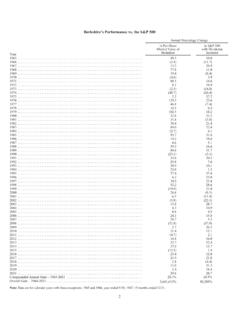
5 3 Table 2. Annual Price Escalation Rates for Water Utilities in the United States .. 9 Table 3. Annual Price Escalation Rates for Wastewater Utilities in the United States .. 14 Table Water Utility Volume Charge in 2016$ per kGal for Large Industrial Consumers .. 22 Table Wastewater Utility Volume Charge in 2016$ per kGal for Large Industrial Consumers .. 23 Annual Water and Wastewater Price Escalation Rates vii Preface Annual Water and Wastewater Price Escalation Rates are needed for Department of Energy s Federal Energy Management Program (FEMP) to make informed decisions using life-cycle cost analyses (LCCA) on Water efficiency projects. However, determining appropriate Water and Wastewater Price Escalation Rates can be difficult, and regional data on the topic is often unavailable.
6 For these reasons, Pacific Northwest National Laboratory (PNNL) conducted this study for FEMP to identify trends in Annual Water and Wastewater Price Escalation Rates across the To develop a sample set of Water and Wastewater Annual Price Escalation Rates throughout the , PNNL used the American Water Works Association Water and Wastewater rate surveys to gather historical rate data for Water and Wastewater utilities in the United States. This data was compiled and assessed to produce a single dataset of time series rate data for more than 60 Water utilities and 40 Wastewater utilities located throughout the (see Figure ). An Annual Price Escalation rate was calculated for each utility based on the reported Rates for the past 8 years, and statistical trends in the Annual Price Escalation Rates are provided by the seven regions identified in Figure Figure Map of the United States Showing the Water and Wastewater Utilities in this Study This report also provides guidance on how to develop localized Water and Wastewater Price Escalation Rates for use in LCCA models.
7 Although the preferred source for a forecast of Annual Water and Wastewater Price Escalation Rates is the local Water or Wastewater utility, suggestions are provided to develop alternative estimates when this local data is not available, which include relying on selected regional historical Annual Price Escalation Rates in this study. Annual Water and Wastewater Price Escalation Rates 1 1 Introduction Pacific Northwest National Laboratory (PNNL) conducted this study for the Department of Energy s (DOE) Federal Energy Management Program to identify trends in Annual Water and Wastewater Price Escalation Rates across the United States. Determining appropriate forecasts of Water and Wastewater Price Escalation Rates is necessary for life-cycle cost analysis (LCCA) of Water projects; there is currently no publicly available comprehensive projection of Price Escalation Rates for Water and Wastewater in the United States.
8 While DOE s Energy Information Administration (EIA) forecasts future changes in energy prices, no governmental organization projects future changes in Water and Wastewater prices. Energy prices are significantly driven by commodity prices, whereas infrastructure projects often drive large variances in Price escalations across Water and Wastewater service providers. The purpose of this analysis is to develop a sample set of Water and Wastewater Annual Price Escalation Rates from utilities throughout the to facilitate the appropriate integration of such factors in LCCAs of Water efficiency projects. Annual Water and Wastewater Price Escalation Rates 2 2 Analysis Method PNNL used the American Water Works Association (AWWA) Water and Wastewater rate surveys to gather historical rate data for Water and Wastewater utilities in the United States.
9 This data was compiled and assessed to produce a single dataset of time series rate data for more than 60 Water utilities and 40 Wastewater utilities located throughout the United States. An Annual Price Escalation rate was calculated for each utility based on the reported Rates for the past 8 years. Data Source The AWWA is a nonprofit Water -industry-focused association dedicated to providing information and solutions related to effective Water management. The AWWA Water and Wastewater rate surveys collect information on the Water and Wastewater Rates and associated fees and charges from communities across North America, inclusive of the United States, Canada, and Puerto Rico. Each survey breaks down the utilities surveyed by location, demand, and revenue received over the previous 2 years for both Water services and Wastewater services.
10 Water services include collection and management of source Water treatment to potable Water standards, and distribution. Wastewater services include collection and treatment to permit requirements for discharge. To carry out this analysis, the results of the 2008, 2010, 2012, 2015, and 2016 AWWA Water and Wastewater rate surveys (AWWA and RFC 2008, 2010, 2012, 2015, 2016)1 were compiled and examined. Although participation in the survey is voluntary, in its most recent (2016) survey, AWWA collected Water data from more than 260 Water utilities and more than 180 Wastewater utilities in 42 states. Using the AWWA survey results conducted and published over multiple years provided consistency to how the data was presented, and resulted in more time series results to include in this study than what was available in previous analyses (Giever 2010).