Transcription of Water Content against Temperature for constant Relative ...
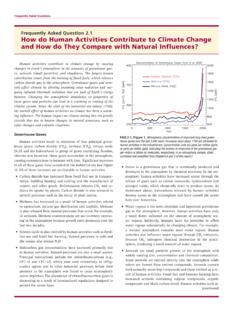
1 humidity , Relative humidity and Temperature humidity is defined as the mass of Water vapour per unit of volume air. Conventionally, humidity is quantified by the Relative humidity which, as the name says, is a Relative quantity. Relative humidity is defined by the ratio: The Relative humidity is a consistent measurement of the humidity only if combined with the corresponding Temperature . This quantity represents the amount of moisture that can be held by a sample of air at a specific Temperature . The graph below shows that, despite having the same Relative humidity , Water Content is varies considerably with Temperature . All the RH curves have the same trend. In addition, it can be seen that air at lower temperatures can hold a smaller amount of Water than air at higher temperatures. Due to the definition of Relative humidity , if the maximum possible amount of Water Content in the air rises but the actual quantity present in the air remains the same, the ratio decreases.
2 As a consequence: If air Temperature increases, Relative humidity decreases If Air Temperature decreases, Relative humidity increases 0 5 10 15 20 25 30 35 40 45 0 10 20 30 40 50 60 Water Content (g/m^3) Air Temperature ( C) Water Content against Temperature for constant Relative humidity 40% RH What is the dewpoint? Referring to the definition of The dewpoint is the Temperature that is reached by cooling a sample of air at constant pressure to produce 100% Relative humidity (saturated air). When the air is saturated: saturation pressure = actual partial pressure At the dewpoint, air can no longer hold the Water vapour contained in the air, hence visible Water will start to appear. At this stage, Water coexists at liquid and vapour states. This is defined as dynamic equilibrium because the Water present in the air is condensing and evaporating at the same rate. When the Temperature decreases further below the dewpoint, there is a change of state and Water will deposit on the surfaces in the form of drops and droplets.
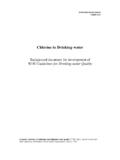
3 When the air is unsaturated (<100% RH), the Temperature at dewpoint is lower than the air Temperature , whereas when the air gets saturated (100% RH), these two value coincide. NOTE: The Temperature at dewpoint can never be higher that the air Temperature . For moisture protection purposes, the dewpoint is extremely important. If the air Temperature and the dewpoint have the same value, condensation tends to form on the surfaces. Formation of condensation is the cause of several systems failure, dramatically reducing the performance and reliability of instruments. In addition, surface moisture leads to formation of corrosion. If we want to avoid this phenomenon and keep a dry environment, the air Temperature should be far from the dewpoint. The picture illustrates some of the most common consequences of the presence of moisture. CONDENSATION RUST MOULD An example is provided to summarise all the concepts explained so far.
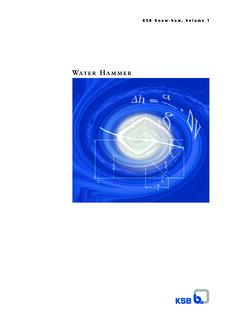
4 EXAMPLE 1: How can we calculate the Water Content (g/m ) and the dewpoint in a sample of air if the air Temperature and the Relative humidity are known? For example, let s find together the Water Content in grams of 1 m of air at 20 C and 60%RH. To determine this value we need the Psychometric Chart of Humid Air. The Psychometric Chart plots in the same graph Temperature , Relative humidity and Water Content . For simplicity, we start from the horizontal axis (air Temperature ) and we look for 20 C (point A). From point A, we raise vertically and we reach the intersection with the curve at 60%RH (point B). The answer is on the correspondent point on the vertical axis (point C), approximately 12 g/m . Therefore, 1 m of air at 20 C and 60%RH contains 12 g of Water vapour . Finally, to determine the dewpoint in the same conditions, follow the intersection of the 100%RH down vertically to point D.
5 In this case, the dewpoint is approximately 10 C. NOTE: This can be misleading because we define the Relative Temperature as a ratio of pressures but here we are talking about Water vapour Content . These two quantities are proportional, therefore when the amount of Water vapour in the air increases, also the pressure exerted by the Water vapour increases. Hence, we usually refer to Water vapour Content instead of Water vapour pressure due to the fact that it is a more quantifiable value. Another important concept to understand is that, unlike the Relative humidity , the dewpoint is an absolute measure of the humidity of the air and it is not Temperature dependent. The following example will clarify this concept. EXAMPLE 2: From the red line on the graph, it can be easily determined that 1 Kg of air at 20 C can hold up to 18 g/m of Water vapour , which corresponds to saturation (see previous example).
6 Due to the fact that 1 Kg of air has a volume of m (density Kg/m ), 1 Kg of air at 20 C can hold up to g of Water vapour . The sample of 1 Kg of air at any Temperature (above 20 C) on the blue dotted line in the graph contains g of Water vapour and has dewpoint 20 C. Logically the air Temperature cannot be lower than 20 C because of what has been explained in the previous paragraph. In fact, lower temperatures cannot hold this amount of Water vapour .