Transcription of weather WEEKLY WEATHER AND CROP BULLETIN - USDA
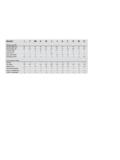
1 Volume 105, No. 4 January 24, 2018. WEEKLY WEATHER . AND CROP BULLETIN . DEPARTMENT OF COMMERCE DEPARTMENT OF AGRICULTURE. National Oceanic and Atmospheric Administration National Agricultural Statistics Service National WEATHER Service and World Agricultural Outlook Board HIGHLIGHTS. January 14 20, 2018 Contents Highlights provided by usda /WAOB. A. extreme Maximum & Minimum Temperature Maps .. 2. final blast of bitterly cold air reached deep into the Temperature Departure Map .. 3. South, preceded by another batch of wintry January 16 Drought Monitor &. precipitation. The cold snap, which peaked on January 17- Seasonal Drought Outlook .. 4. 18, held Southeastern WEEKLY temperatures 5 to 15 F Freeze in Florida Specialty Crop Areas .. 5. National WEATHER Data for Selected Cities .. 6. below normal and threatened winter crops in Florida and 2017 United States WEATHER Review.
2 9. Louisiana. Producers in Florida used irrigation (ice caps) 2017 National WEATHER Data for Selected 13. to help protect crops such as citrus and strawberries, while 2017 Precipitation & Temperature Maps .. 14. 2017 United States Fieldwork Highlights .. 17. growers in Louisiana monitored sugarcane for signs of 2017 United States Crop Production Highlights .. 19. freeze injury. In addition, snow covered the ground across National Agricultural Summary .. 22. large sections of the South for several days, starting International WEATHER and Crop 23. BULLETIN Information & Snow Cover Map .. 32. (Continued on page 3). 2 WEEKLY WEATHER and Crop BULLETIN January 24, 2018. January 24, 2018 WEEKLY WEATHER and Crop BULLETIN 3. (Continued from front cover). around mid-month. Snow, albeit mostly light, also fell in parts of the Midwest and Northeast.
3 Meanwhile, mild WEATHER prevailed in the West and returned to the northern Plains and upper Midwest. WEEKLY temperatures averaged at least 10 F. above normal in parts of the interior West. Significant precipitation, confined for much of the week to the Pacific Northwest, eventually overspread other sections of the western Despite the late-week precipitation, abysmally low snowpack continued to plague many river basins from California to the central and southern Rockies. Elsewhere, mostly dry WEATHER accompanied a warming trend on the Plains. Across the southern half of the Plains, stress on winter wheat has been compounded by a variety of factors, including poor establishment, intensifying drought, and temperature extremes. On January 16-17, sub-zero temperatures were noted as far south as northern Oklahoma;. by January 20, readings on the southern Plains approached or reached 80 F.
4 At week's end, snow developed across portions of the northern High Plains in advance of an approaching storm system. Greenwood, MS (9 and 5 F); and Waco, TX (15 and 8 F). On January 17 in Arkansas, temperatures plunged to their lowest levels since On January 15, a dusting of snow ( inch) in Wichita, KS, marked the December 1989 in locations such as Mena (-1 F); El Dorado (3 F); and first accumulation in that location since December 17, 2016, when Texarkana (6 F). Similarly, Longview, TX (8 F on January 17), inches fell. Therefore, Wichita's longest-ever streak without measurable reported its lowest reading since December 23, 1989, when it was 2 F. In snow ended at 393 days. Farther east, however, snow blanketed parts of Louisiana, minimum temperatures on January 17 fell to 16 F in the mid-South and lower Midwest. For example, January 15 was the Lafayette and 20 F in New Orleans; it was the coldest day in both fifth-snowiest day on record in Paducah, KY, where inches fell.
5 Locations since February 5, 1996. Lafayette also achieved a daily-record Other daily-record snowfall totals for January 15 included inches in low (17 F) the following day, on January 18. From January 16-18, Evansville, IN, and inches in Springfield, MO. A day later, snow Vicksburg, MS, posted a trio of daily-record lows (13, 11, and 8 F). By spread into the central Appalachians. In West Virginia, daily-record January 18, daily-record lows in Florida plunged to 25 F in Lakeland totals for January 16 reached inches in Charleston and inches in and 29 F in Tampa. For Tampa, it was the first freeze since January 13, Elkins. Meanwhile, wintry precipitation (snow, sleet, and freezing rain) 2011, and the lowest temperature since January 11, 2010, when it was affected the Deep South. January 16 featured daily-record snowfall totals 25 F. Elsewhere, late-week warmth expanded across the western and in locations such as Shreveport, LA ( inches); Meridian, MS ( central Salt Lake City, UT, logged consecutive daily-record highs inch); and Houston, TX ( inch).
6 (Houston also received inch on (56 and 58 F, respectively) on January 18-19. On the central High December 7-8, 2017; as a result, the city has experienced measurable Plains, daily-record highs for January 19 reached 74 F in Goodland, KS, snow in consecutive months for the first time since January-February and Burlington, CO. On the 20th, daily-record highs in Texas surged to 1985.) Record-setting snowfall totals in Georgia for January 17 reached 81 F in Childress and 80 F in Borger, and in Iowa rose to 52 F in inches in Columbus, inches in Athens, and inch in Macon. Mason City and 50 F in Waterloo. Similarly, daily-record amounts in North Carolina for January 17. included inches in Greensboro and inches in Raleigh-Durham. Uncommonly mild WEATHER dominated Alaska, with WEEKLY Later, significant precipitation arrived in parts of the West.
7 Alturas, CA, temperatures averaging at least 20 F above normal in many eastern netted a daily-record total ( inch) for January 18. In Nevada, Ely locations and averaging more than 10 F above normal nearly received daily-record precipitation and snowfall totals ( and statewide. Sunday the 14th was the warmest January day on record in inches, respectively) on January 19. That represented Ely's greatest Alaska communities such as Annette Island (66 F; previously, 61 F. calendar-day snowfall since January 13, 1907, when inches fell. on January 19, 1961, and January 14, 1981) and Sitka (63 F;. Meanwhile in Utah, 24-hour snowfall totals on January 19-20 included previously, 60 F on January 1, 1946). Sitka also posted four 10 inches in Tooele and 8 inches in Spanish Fork. Finally, January 20- consecutive daily-record highs (53, 63, 60, and 54 F) from January 13- 21 snowfall totals in Wyoming reached inches in Casper and 16.
8 In some parts of Alaska, significant precipitation accompanied the inches in Lander. mild conditions. For example, WEEKLY snowfall in Fairbanks totaled inches, aided by a daily-record sum of inches on January 17. In advance of the Western storminess, record-setting warmth prevailed. From January 12-16, rainfall in Yakutat totaled inches. Farther On January 15, Seattle, WA (64 F), tied a monthly record high originally south, warm, mostly dry WEATHER prevailed in Hawaii. Honolulu, set on January 20, 1981. Another surge of Northwestern warmth on Oahu, received its first measurable rain of the month inch on January 17 resulted in daily-record highs in locations such as Roseburg, January 20. Through the 20th, month-to-date rainfall at the state's OR (71 F), and Walla Walla, WA (66 F). Farther east, however, daily- major airport observation sites ranged from a trace ( inches below record lows for January 16 plunged to -6 F in Joplin, MO, and 1 F in normal) in Kahului, Maui, to inches (41 percent of normal) in Dalhart, TX.
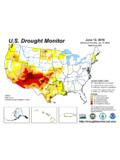
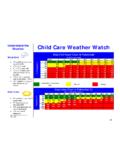
9 Consecutive daily-record lows were established on January Hilo, on the Big Island. However, Hilo's rain intensified late in the 16-17 in several locations, including Batesville, AR (6 and 4 F); week, when inches fell from January 18-20. 4 WEEKLY WEATHER and Crop BULLETIN January 24, 2018. January 16, 2018. Drought Monitor (Released Thursday, Jan. 18, 2018). Valid 7 EST. SL. S L. S. SL. S. SL. Drought Impact Types: S Delineates dominant impacts S = Short-Term, typically less than S 6 months ( agriculture, grasslands). L = Long-Term, typically greater than 6 months ( hydrology, ecology). Intensity: Author: D0 Abnormally Dry Brian Fuchs D1 Moderate Drought National Drought Mitigation Center S D2 Severe Drought D3 extreme Drought D4 Exceptional Drought The Drought Monitor focuses on broad- scale conditions. Local conditions may vary. See accompanying text summary for forecast statements.
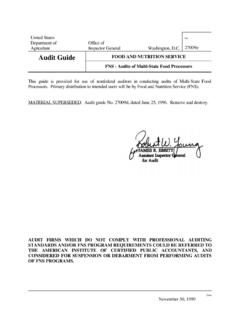
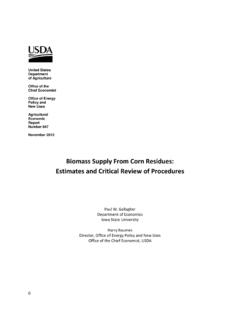
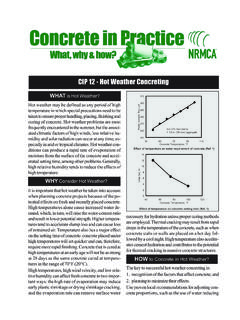
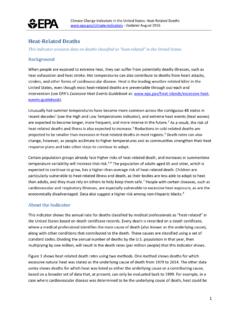
10 S. January 24, 2018 WEEKLY WEATHER and Crop BULLETIN 5. United States Department of Freeze in Florida Specialty Crop Areas Agriculture This product was prepared by the Minimum Temperatures ( F). usda Office of the Chief Economist (OCE). World Agricultural Outlook Board (WAOB) January 18, 2018 (Updated - Jan 18, 2018). Data Sources: - Temperature data obtained from the 25. Florida Automated WEATHER Network. - Agricultural data obtained from the 24 usda National Agricultural Statistics 23 25. Service. 24 26. 26. 26 27. 28. 25 28. Major Strawberry Area 32. 26 31. Major Citrus Area 28 27. Minor Citrus Area 30. 34. 31. Cloud Cloud GOES-16 Visible January 17, 2018 Cloud 10:42 am EST. Back-to-back storms on January 12 and 15-16 left large sections of several Southern States including Louisiana, Mississippi, and Alabama under a blanket of snow, as shown in this visible satellite image from the morning of January 17.