Transcription of Weekly Economic Indicators
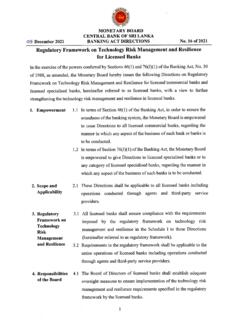
1 Weekly Economic Indicators 17th December 2021. Statistics Department Central Bank of Sri Lanka Highlights of the Week Real Sector The GDP contracted by per cent in real terms in the 3rd Quarter of 2021. Agriculture activities expanded by per cent while Industry and Services activities contracted by per cent and per cent, respectively. Further, Taxes less subsidies on products contracted by per cent during the 3rd Quarter of 2021. Benefitting from the normalising of Economic activities in the country, the Purchasing Managers' Indices for both Manufacturing and Services activities expanded further in November 2021, recording and index values respectively.
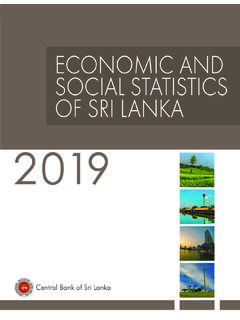
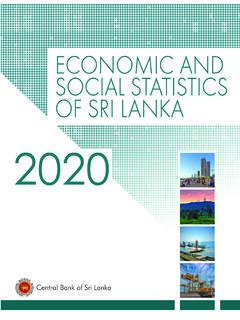
2 During the first ten months of 2021, domestic tea production increased notably in comparison to the corresponding period of the previous year owing to favourable weather conditions. Production of rubber also increased in response to high market prices while coconut production increased considerably due to the lagged effect of favourable weather conditions prevailed during the latter part of 2020. During the period under review ( to ), crude oil prices showed a mixed performance. Prices declined due to oversupply concerns, strong US dollar and on the EIA statement that Omicron coronavirus variant could dent global demand recovery.
3 Towards the end of the period, crude oil prices increased owing to strong US. demand and the Federal Reserve's statements on ending its pandemic-era bond purchases in March 2022. Overall, both Brent and WTI prices decreased by US dollars and US dollars per barrel, respectively, during the period. Monetary Sector Weekly AWPR for the week ending 17th December 2021 increased by 11 bps to per cent compared to the previous week. The reserve money increased compared to the previous week mainly due to the increase in currency in circulation and increase in deposits held by the commercial banks with the Central Bank.
4 The total outstanding market liquidity was a deficit of Rs. bn by the end of this week, compared to a deficit of Rs. bn by the end of last week. By 17th December 2021, the All Share Price Index (ASPI) increased by per cent to 11, points and the S&P. SL 20 Index increased by per cent to 4, points, compared to the index values of last week. Outstanding central government debt increased to Rs. 17, bn by end August 2021 from Rs. 15, bn as at External Sector During the year up to 17th December 2021, the Sri Lankan rupee depreciated against the US dollar by per cent.
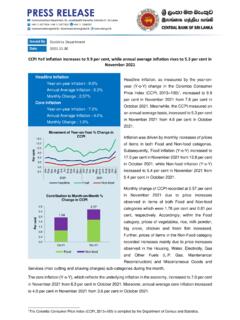
5 Given the cross currency exchange rate movements, the Sri Lankan rupee appreciated against the Japanese yen by per cent and the Euro by per cent while depreciating against the Indian rupee by per cent and the pound sterling by per cent during this period. Real Sector Price Indices October Month NCPI - Year-on-Year %. NCPI(2013=100) 2021 Ago Year Ago 10. National Consumer Price Index (NCPI) - Headline Per cent Monthly Change % Annual Average Change % 6. Year - on - Year Change % 2020. National Consumer Price Index (NCPI) - Core 2021.
6 Annual Average Change % 2. J F M A M J Jy A S O N D. Year - on - Year Change % Month November Month CCPI(2013=100) 2021 Ago Year Ago CCPI - Year-on-Year %. Colombo Consumer Price Index (CCPI) - Headline 10. 2020. Monthly Change % Per cent 8 2021. Annual Average Change % 6. Year - on - Year Change % Colombo Consumer Price Index (CCPI) - Core 4. Annual Average Change % 2. Year - on - Year Change % J F M A M J Jy A S O N D. Month Source: Department of Census and Statistics Prices Pettah Market Average Wholesale Prices Average Retail Prices Food Item Week Month Year This Week Month Year This Week Ago Ago Ago (a) Week Ago Ago Ago (a).
7 Rice Samba Kekulu (Red) Vegetables Beans Cabbage Carrot Tomato Pumpkin Snake Gourd Brinjal Other Foods Red Onion (Local) Big Onion (Imported) Potato (Local) Dried Chilli (Imported) Dhal Egg - White (Each) Coconut (Each) Green Chilli Lime Fish (b). Kelawalla Balaya Salaya Hurulla (a) Pettah retail market was not in operation during third week of December 2020. (b) In Peliyagoda Fisheries Trade Centre retail trade activities were not carried out since 21 st October 2020. - not available Narahenpita Economic Centre-Retail Prices Beans 2020 2020.
8 550 Brinjal 2021. 2021 450. 450. 350. 350. 250 250. 150 150. 50 50. Week Week 2020 2020. Rice - Samba 2021 Fish - Kelawalla 185 1800 2021. 165. 1500. 145. 1200. 125. 900. 105. 600. 85. 300. Week Week Potato (Local) 2020. 2021 100. Coconut 370. 320 80. Rs/Each 270 60. 220 2020. 170 40. 2021. 120 20. Week Week Dambulla Market Narahenpita Economic Centre Average Wholesale Prices Average Retail Prices Item ( ) Item ( ). This Week Week Ago This Week Week Ago Rice Rice Samba Samba Kekulu (Red) Kekulu (Red) Vegetables Vegetables Beans Beans Cabbage Cabbage Carrot Carrot Tomato Tomato Pumpkin Pumpkin Snake Gourd Snake Gourd Brinjal Brinjal Ash Plantain Ash Plantain Other Foods Other Foods Red Onion (Local) Red Onion (Local) Big Onion (Imported) Big Onion (Imported) Potato (Local) Potato (Local) Dried Chilli (Imported) Potato (Imported) Coconut (Each) Dried Chilli (Imported)
9 Marandagahamula Market Dhal Sugar - White Average Wholesale Price of Rice Egg - White (Each) Coconut (Each) Item This Week Week Ago Month Ago Year Ago Green Chilli ( ). Fish Samba Kelawalla 1, 1, Kekulu (White) Balaya Kekulu (Red) Salaya Nadu Hurulla - not available GDP by Industrial Origin at Constant (2010) Prices - Growth Rates in value added terms 2019 2020 2021 2021. Item % Change Real GDP. Annual (a)(b) Annual (a) 2nd Qtr (a)(b) 3rd Qtr (a) Agriculture ( ) Industry ( ) ( ) Services ( ) ( ) 15' Q1 16' Q3 18' Q1 19' Q3 21' Q1.
10 Taxes less subsidies on ( ) ( ) products GDP ( ) ( ) Quarter (a) Provisional (b) Revised Source: Department of Census and Statistics Agricultural Production 2020 2021 Tea Production Item Unit %Change Jan - Oct (a) Jan - Oct (b) 300. Tea (mn kg) 200. Rubber (mn kg) 2020. 100. 2021. Coconut (mn Nuts) 2, 2, 0. J F M A M J Jy A S O N D. (a) Revised Month (b) Provisional Index of Industrial Production (IIP) (2015 = 100) (a). October Index Index of Industrial Production Item % Change 2020 (b) 2021 (c) 120. Index of Industrial Production (IIP) 100.