Transcription of What Is the Impact of Decline in Science …
1 1 What Is the Impact of Decline in Science Instructional Time in elementary School? Time for elementary Instruction Has Declined, and Less Time for Science Is Correlated with Lower Scores on NAEP Rolf K. Blank, Paper prepared for the Noyce Foundation 2012 2 Contents Page Executive Summary .. 3 Introduction .. 5 Key Findings .. 7 Figure 1. Trends in elementary Instructional Time: 1988 to 2008 .. 9 Figure 2. State NAEP Science Score by Percentage of Students Eligible for Free or Reduced-Price Lunch, Grade 4, 10 Figure 3. Science Instructional Time per week: comparing average hours per week in Oregon, Kentucky, and the national Figure 4. State NAEP Score by Science Instructional Time, Grade 4, 14 Figure 5. NAEP Score by Science Class Time and Eligibility for Free or Reduced-Price 15 Figure 6: NAEP State Score by Percentage of Classes with Hands-on Science Activities Daily or Weekly, Grade 4, 2009.
2 17 Conclusion .. 19 References .. 20 Rolf K. Blank is a program director with the Council of Chief State School Officers, Washington, DC. The views, findings, and conclusions presented in the paper are not necessarily supported by the Council or its members. 3 Executive Summary Key Finding 1. Instructional time for Science in the elementary grades has dropped to an average of hours per week, the lowest level since 1988. National trends analysis shows a Decline in time for elementary Science instruction, and there is wide variability across the states in the average class time spent on Science education. NAEP data for grade 4 classrooms show several states averaging over hours per week in Science instruction (45 minutes per day) while other states are averaging only 2 hours per week (25 minutes per day).
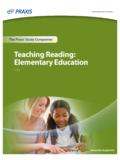
3 At a time when proficiency in Science is more important than ever, the average time students spend learning Science in the elementary grades is declining. Through the late 1980s and 1990s, time spent on both Science and mathematics had been increasing until shortly before passage of the No Child Left Behind (NCLB) law in 2001, currently referred to by its more formal title, the Education and Secondary Education Act (ESEA). Since then, instructional time for math has increased modestly and held steady, time for English language arts (ELA) has increased substantially, and time for Science has dropped to an average of hours per week, the lowest level since 1988, as shown below. elementary Instructional Time (Hours per Week) by Subject Source: SASS Public School Teacher Survey. Standard errors for average hours by subject and year vary from to Key Finding 2.
4 Aggregated national and state data indicate that less time for Science is correlated with lower scores, accounting for approximately 12 points on the NAEP Science Scale at grade 4. Data from the 2009 fourth grade NAEP Science assessment includes information on both student achievement and information from teachers and schools on a number of variables, including time spent on Science instruction, teacher preparation, frequency of hands-on Science instruction, and student demographics. A variety of educational and societal factors explain differences in student achievement scores in Science . This paper looks closely at one key factor controlled by schools and teachers time on Science instruction. States averages vary widely in class time spent on Science , with average hours per week ranging from hours per week in Oregon to hours per week in Kentucky.
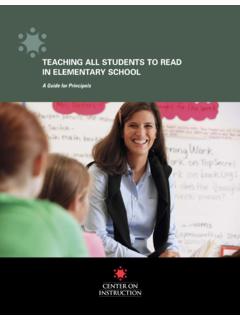
5 Analysis of data on instructional time indicates that time on Science is correlated with student performance. States also vary widely in the percent of students who are receiving free or reduced-price lunch, a proxy measure for low income. The figure below shows that low-income students eligible for free or reduced-price lunch who receive more than three hours Science instruction per week score 12 points higher on NAEP 4th grade Science than students receiving less than one hour per week. However, there is still a 28-point achievement gap between low-income students and other students, as shown below. 4th Grade NAEP Science Scores, By Hours per Week Spent on Science and Student Eligibility for Free or Reduced-Price Lunch Source: NAEP Data Explorer, Standard error on achievement statistic = + 3 points.
6 The results of our analysis of trends in class time for elementary Science in public schools are especially troubling given recent research that indicates that students who ultimately decide to take advanced Science classes in high school, and major in high-demand Science , technology, engineering and 120130140150160170180< 1 - - - hr> 4 hrEligibleNot Eligible5 mathematics (STEM) fields in postsecondary education, tend to get hooked on STEM and make their choices as early as middle school. The findings also are particularly relevant as both the federal government and the business community step up their efforts to increase Science proficiency and advanced STEM learning, and as Congress considers possible changes in the ESEA law. Introduction Current education policy discussions are focused on how to advance the quality and effectiveness of Science and mathematics education for all students.
7 New reports from the National Research Council (NRC) (2012) and National Governors Association (NGA) (2011) call attention to possible strategies for increasing the participation and preparation of more students in the Science , technology, engineering and mathematics (STEM) fields. Two primary issues are summarized in these reports: First, there is a high demand for high school graduates who are prepared to enter careers requiring STEM knowledge (President s Council of Advisers on Science and Technology, 2012). By 2018, there will be more than million job openings for STEM workers; 92 percent of these jobs will require at least some postsecondary education (Carnevale, Smith & Stroll, 2010). Second, results from the TIMSS and PISA international studies indicate that average student performance on Science and math assessments do not compare favorably with results for students in leading industrialized nations (OECD, 2010; Provasnik, Gonzales & Miller, 2009).
8 For the past several years, the Congress has been debating reauthorization of the elementary and Secondary Education Act (ESEA) and examining the effects of its 2001 reauthorization as No Child Left Behind (NCLB). The NCLB law requires state testing and accountability reporting for reading and math at each grade 3 through 8 and one high school grade. Science must be tested at three grades but Science scores are not included in school accountability annual progress determinations. One question under close consideration is the effect of accountability requirements under NCLB as well as under prior state and federal accountability policies. The NRC report recommends changes in the current law to reinforce the role of Science education in schools (2011, p. 21). The National Science Teachers Association (NSTA) has advocated for increased time in the school curriculum as a key ingredient to improving Science education and student outcomes, especially in the elementary grades (NSTA, 2002; see webpage for current position statement, ).
9 Additionally, greater emphasis is expected on Science education in the near future. Twenty-six states have joined with the NRC, NSTA, the American Association for the Advancement of Science , and Achieve in leading the development of Next Generation Science Standards. Draft standards, which are based on 6 the Framework for K 12 Science Education developed and published by NRC (2012), were released May 11 of this year, and a final version will be out in early 2013. The elementary and middle school years could well be the best time to capture students interest in and motivation to pursue postsecondary STEM learning. A review of some 150 key studies of children s attitudes toward Science found that their interests in Science tend to Decline from age 11 onwards (Osborne, 2003). In a recent survey of college students, meanwhile, nearly four in five STEM majors (78 percent) said they decided to study STEM in high school or earlier and one in five (21 percent) said they made their decisions in middle school or earlier (Harris Interactive, 2011).
10 About This Study This paper addresses the question of trends in time spent on Science instruction in public schools, and the relationship between instructional time and achievement, using a state comparative analysis. Class time for Science instruction is a key indicator of opportunity to learn. Researchers on time and learning have found that class time needs to be allocated regularly during the school day and week, and that instructional time is a key equity issue (for research on time and learning, see Traphagen, 2011; Gettinger, 1985; Karweit, 1983; National Center on Time and Learning, 2010). Time devoted to core academic subjects was a primary focus of the reform recommendations of the National Commission on Excellence in Education report, A Nation at Risk (1983). In the ensuing years, almost all states increased core academic subject requirements continuing to the present, with a particular focus on math and Science education (Stillman & Blank, 2009).