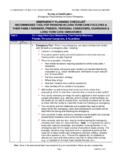
Transcription of Who Pays for Long-Term Care in the U.S.? (Updated)
1 pays for Long-Term care in the (Updated)Fact Sheet January care Costs Long-Term care spending includes spending for nursing homes that provide medical and supportive services to people with significant functional and/or cognitive impairment; intermediate care facilities for individuals who do not need continuous nursing care , but require supervision and personal assistance; home health services; and home- and community-based services (HCBS), such as personal assistance with eating, bathing or dressing provided in one s home or community. In fiscal year (FY) 2010, total spending (public, out-of-pocket and other private spending) for Long-Term care was $ billion, or 8% of all personal health care Medicaid is the dominant source of payment for Long-Term care , followed by out-of-pocket payments by individuals and families (See Figure 1).1 Many older adults and people with disabilities of all ages require supportive services, known as Long-Term care .
2 As the population ages, demand for Long-Term care is increasing, along with the spending on these services. Long-Term care services are financed primarily by public dollars, with the largest share financed through Medicaid, the federal/state health program for low-income individuals. Long-Term care services are also financed privately through out-of-pocket payments by individuals and their families and Long-Term care insurance. This fact sheet describes how Long-Term care is financed, nationally. Long-Term care Expenditures by Source, FY 2010 FIGURE 1 Source: O Shaughnessy CV. The Basics: National Spending for Long-Term Services and Supports. 2012 Note: Other Private includes private Long-Term care insurance, other health insurance, and other private spending for nursing homes and home health services. Other Public includes Department of Veterans Affairs, state and local programs, and general assistance spending for nursing homes and home health services.
3 Sheet January Long-Term care expenditures from all sources combined are projected to increase from $ billion in 2010 to $346 billion in The median annual cost for different types of Long-Term care services in the in 2012 varied, with nursing homes being the most expensive (See Figure 2).4 Public Financing Medicaid Long-Term care expenditures for FY 2010 totaled $ billion or approximately 31% of total Medicaid In FY 2010, approximately 45% of Medicaid Long-Term care funding was spent on HCBS. About 55% was directed toward institutional Long-Term care , which includes nursing homes and intermediate care facilities for people with developmental disabilities, and mental health facility The Program of All-inclusive care for the Elderly (PACE) provides integrated care to vulnerable elders from an interdisciplinary team of health care and other Medicaid expenditures for the PACE program in FY 2010 totaled about $ Annual Costs for Selected Long-Term care Services in the , 2012 FIGURE 2 Source: Genworth Financial.
4 Genworth 2012 Cost of care Survey: Home care Providers, Adult Day Health care Facilities, Assisted Living Facilities and Nursing Homes. : Annual costs for home health aide/homemaker services are based on 44 hours of care per week, multiplied by 52 weeks. Annual costs for adult day health care are based on a daily 6-8 hour rate for 5 days a week, multiplied by 52 weeks. $81,030$73,000$43,472$41,184$39,600$15,8 60 Nursing home (private room)Nursing home (semi-private room)Home Health Aide (Licensed)Homemaker ServicesAssisted Living Facility(one-bedroom unit)Adult Day Health care Center$0$20,000$40,000$60,000$80,000$100 ,000 Fact Sheet January Spending Nationally, median annual private pay costs for nursing home services average 241% of an older person s annual income. This ranges from 166% to 444% across Median annual private pay costs for home health services average 88% of an older person s annual income, nationally.
5 This ranges from 55% to 125% across One in four people age 45 and over are not at all prepared financially if they suddenly required Long-Term care for an indefinite period of Approximately 56% of individuals age 65 and older (as compared to adults 45-64) and more than half of adults with incomes over $25,000 annually were more likely to say they feel financially prepared for Long-Term care than their Long-Term care Insurance Private Long-Term care insurance is one way that individuals can finance their Long-Term care needs. In 2010, between 7 and 9 million Americans owned a private Long-Term care insurance (LTCI) policy, reflecting between and of the US population age 45 and ,10 The composition of the private LTCI market has changed as employer-sponsored LTCI has grown as a share of the total LTCI market. In 2011, employer-sponsored LTCI represented about one-third of all active policies, compared with less than 3% in the Among employers offering LTCI, the federal government is the largest employer offering group The average annual premium for a Long-Term care insurance policy purchased in 2010 was approximately $2,255 for individuals age 55 to 64, $2,759 for those age 65-69 years old, and $3,294 for those age 70 to of Family Caregivers Most Long-Term care is provided, unpaid, by family members and friends.
6 The estimated economic value of unpaid caregiving in 2009 was $450 billion, compared to $375 billion in Including these costs in the total estimate of Long-Term care spending would increase this figure by about 116%.References1. O Shaughnessy CV. The Basics: National Spending for Long-Term Services and Supports. 2012; Accessed July 19, Sheet January 2013 For more information contact: The SCAN FoundationLisa R. Shugarman, , Director of Policy3800 Kilroy Airport Way, Suite 400, long Beach, CA (888) 569-7226 | Follow us on Twitter Find us on Facebook2. Congressional Budget Office (CBO). Projections of Expenditures for Long-Term care Services for the Elderly 1999; Accessed September 2, Feinberg L, Reinhard S, Houser A, Choula R. Valuing the Invaluable: 2011 Update: The Growing Contributions and Costs of Family Caregiving. 2011; Accessed November 8, Genworth Financial. Genworth 2012 Cost of care Survey: Home care Providers, Adult Day Health care Facilities, Assisted Living Facilities and Nursing Homes.
7 2012; Accessed November 14, Eiken S, Sredl K, Burwell B, Gold L. Medicaid Expenditures for Long-Term Services and Supports: 2011 Update. 2011; Accessed October 12, Medicare Payment Advisory Commission (MedPAC). A Databook: Healthcare Spending and the Medicare Program, June 2010. 2010; Accessed November 14, Reinhard S, Kassner E, Houser A, Mollica R. Raising Expectations: A State Scorecard on Long-Term Services and Supports for Older Adults, People with Physical Disabilities, and Family Caregivers. 2011; Accessed July 16, AARP. Perceptions of Long-Term care and the Economic Recession. 2009; Accessed November 15, Census Bureau. Annual Estimates of the Resident Population by Sex and Five-Year Age Groups for the United States, 2010. 2011; Accessed December 21, America s Health Insurance Plans (AHIP). Who Buys Long-Term care Insurance in 2011-2012? 2012; Accessed October 21, Mulvey J.
8 Factors Affecting the Demand for Long-Term care Insurance: Issues for Congress. 2012; Accessed July 20, 2012.