Transcription of with pandas F M A vectorized M A F operations Cheat Sheet ...
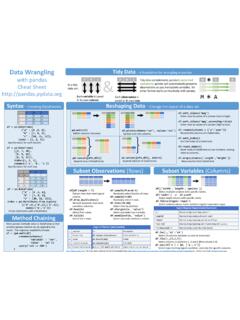
1 FMAData Wranglingwith pandasCheat Creating DataFramesTidy data A foundation for wrangling in pandasIn a tidy data set:FMAEach variableis saved in its own column&Each observation is saved in its own rowTidy data complements pandas svectorizedoperations. pandas will automatically preserve observations as you manipulate variables. No other format works as intuitively with data Change the layout of a data setMAF*MA* (df)Gather columns into (columns='var', values='val')Spread rows into ([df1,df2])Append rows of ([df1,df2], axis=1)Append columns of ('mpg')Order rows by values of a column (low to high).
2 ('mpg',ascending=False)Order rows by values of a column (high to low). (columns = {'y':'year'})Rename the columns of a ()Sort the index of a ()Reset index of DataFrameto row numbers, moving index to (columns=['Length','Height'])Drop columns from DataFrameSubset Observations (Rows)Subset Variables (Columns)abc147102581136912df= ({"a" : [4 ,5, 6], "b" : [7, 8, 9], "c" : [10, 11, 12]}, index = [1, 2, 3])Specify values for each ([[4, 7, 10],[5, 8, 11],[6, 9, 12]], index=[1, 2, 3], columns=['a', 'b', 'c'])Specify values for each ({"a" : [4 ,5, 6], "b" : [7, 8, 9], "c".)}
3 [10, 11, 12]}, index = ([('d',1),('d',2),('e',2)],names=['n','v ']))Create DataFramewith a MultiIndexMethod ChainingMost pandas methods return a DataFrameso that another pandas method can be applied to the result. This improves readability of ( (df).rename(columns={'variable' : 'var', 'value' : 'val'}).query('val>= 200'))df[ > 7]Extract rows that meet logical ()Remove duplicate rows (only considers columns). (n)Select first n (n)Select last n in Python (and pandas )<Less than!=Not equal to>Greater (values)Group membership== (obj)Is NaN<=Less than or (obj)Is not NaN>=Greater than or equals&,|,~,^, (), ()Logicaland, or, not, xor, any, Cheat Sheet inspired by RstudioData wrangling Cheatsheet( ) Written by Irv Lustig, Princeton Consultantsdf[['width','length','species ']]Select multiple columns with specific ['width'] single column with specific (regex='regex')Select columns whose name matches regular expression [:,'x2':'x4']Select all columns between x2 and x4 (inclusive).
4 [:,[1,2,5]]Select columns in positions 1, 2 and 5 (first column is 0). [df['a'] > 10, ['a','c']]Select rows meeting logical condition, and only the specific columns .regex (Regular Expressions) Examples'\.'Matches strings containinga period '.''Length$'Matches strings ending with word 'Length''^Sepal'Matches strings beginning with the word 'Sepal''^x[1-5]$'Matches strings beginning with 'x' and ending with 1,2,3,4,5'^(?!Species$).*'Matches strings exceptthe string 'Species' (frac= )Randomly select fraction of rows. (n=10)Randomly select n [10:20]Select rows by (n, 'value')Select and order top n (n, 'value')Select and order bottom n DataMake New ColumnsCombine data Setsdf['w'].
5 Value_counts()Count number of rows with each unique value of variablelen(df)# of rows in ['w'].nunique()# of distinct values in a ()Basic descriptive statistics for each column (or GroupBy) pandas provides a large set of summary functionsthat operate on different kinds of pandas objects (DataFramecolumns, Series, GroupBy, Expanding and Rolling (see below)) and produce single values for each of the groups. When applied to a DataFrame, the result is returned as a pandas Series for each column. Examples:sum()Sum values of each ()Count non-NA/null values of each ()Median value of each ([ , ])Quantiles of each (function)Apply function to each ()Minimum value in each ()Maximum value in each ()Mean value of each ()Variance of each ()Standard deviation of each (Area=lambda df.)
6 * )Compute and append one or more new ['Volume'] = * * single ( , n, labels=False)Bin column into n functionVector functionpandas provides a large set of vector functions that operate on all columns of a DataFrameor a single selected column (a pandas Series). These functions produce vectors of values for each of the columns, or a single Series for the individual Series. Examples:shift(1)Copy with values shifted by (method='dense')Ranks with no (method='min')Ranks. Ties get min (pct=True)Ranks rescaled to interval [0, 1].rank(method='first')Ranks.
7 Ties go to first (-1)Copy with values lagged by ()Cumulative ()Cumulative ()Cumulative ()Cumulative (adf, bdf,how='left', on='x1')Join matching rows from bdfto (adf, bdf,how='right', on='x1')Join matching rows from adfto (adf, bdf,how='inner', on='x1')Join data . Retain only rows in both (adf, bdf,how='outer', on='x1')Join data . Retain all values, all Joinsx1x2A1B2x1x2C3adf[ ( )]All rows in adfthat have a match in [~ ( )]All rows in adfthat do not have a match in (ydf, zdf)Rows that appear in both ydfand zdf(Intersection).
8 (ydf, zdf, how='outer')Rows that appear in either or both ydfand zdf(Union). (ydf, zdf, how='outer', indicator=True).query('_merge == "left_only"').drop(columns=['_merge'])Ro ws that appear in ydfbut not zdf(Setdiff).Group (by="col")Return a GroupByobject, grouped by values in column named "col". (level="ind")Return a GroupByobject, grouped by values in index level named "ind".All of the summary functions listed above can be applied to a group. Additional GroupByfunctions:max(axis=1)Element-wise (lower=-10,upper=10)Trim values at input thresholdsmin(axis=1)Element-wise ()Absolute examples below can also be applied to groups.
9 In this case, the function is applied on a per-group basis, and the returned vectors are of the length of the original ()Return an Expanding object allowing summary functions to be applied (n)Return a Rolling object allowing summary functions to be applied to windows of length ()Size of each (function)Aggregate group using Missing ()Drop rows with any column having NA/null (value)Replace all NA/null data with ()Histogram for each (x='w',y='h')Scatter chart using pairs of Cheat Sheet inspired by RstudioData wrangling Cheatsheet( ) Written by Irv Lustig, Princeton Consultants