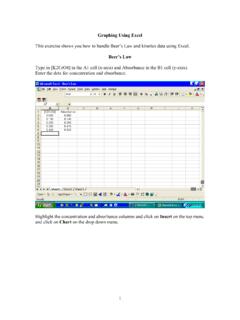
Transcription of Word and Excel Practice Exercise
1 1. Word and Excel Practice Exercise IMPORTANT. While highly recommended as preparation for the Word and Excel Assignment, this Practice Exercise is optional and will not be graded. Solutions to this assignment have been posted. Please note that this Exercise is not exhaustive and does not cover all tasks required on the Word and Excel Assignment. Purpose The purpose of this Practice Exercise is to help prepare you to complete the Word and Excel Assignment. This Exercise requires you to use the following: Microsoft Excel for creating tables, scatter plots, and completing data analysis. Microsoft Word for creating a summary document containing the results and discussion from two Excel Exercise . Specifically, Word will be used to import tables/plots; create text, equations, captions, and drawings; and to use built-in tools for heading styles, automatic referencing and citations, and tables of contents.
2 Relevant Resources The Microsoft Excel tutorials and Microsoft Office Learning Resources are available at You should read this tutorial and refer to these resources while completing the Exercise . If you have any additional questions about the Exercise , you may contact for assistance. Required Software This Practice Exercise can be completed on both PCs and Macs. You will need the following software and plug-ins: 1. Microsoft Excel - Ensure the Analysis ToolPak plug-in is installed in your version. 2. Microsoft Word - Ensure you have the option to use the IEEE reference style in the Word citation management tool. Detailed installation instructions are included in the Microsoft Excel and Word tutorials mentioned previously in Relevant Resources.'. 2. Learning Outcomes Upon successful completion of this assignment, students will be able to: 1. Input experimental data into Microsoft Excel .
3 2. Perform calculations in Microsoft Excel using both manually inputting formulas and built-in functions. 3. Generate simple and effective tables and graphs to describe experimental data in Microsoft Excel . 4. Perform basic data analysis in Microsoft Excel . Specifically, students will be able to perform regression and residual analyses as part of a laboratory error analysis. 5. Properly format and organize a formal laboratory report in Microsoft Word. 6. Integrate both graphs and tables created in Microsoft Excel into a laboratory report in Microsoft Word. 7. Generate equations, sample calculations, and basic diagrams in Microsoft Word. 8. Correctly reference resources used in a formal laboratory report using IEEE format. 9. Critically evaluate experimental results on a basic level. Instructions This assignment contains two questions: 1. Question 1: Specific Weight of Lake Ontario 2.
4 Question 2: Resistance in a Circuit The questions are described in detail beginning on page 6. To complete both questions you will need to create multiple tables and graphs in Microsoft Excel , and you will need to import them into a properly formatted Microsoft Word document. The specific formatting requirements are listed on pages 3 to 5. 3. Formatting Requirements 1. Saving your File The assignment should be saved as a file entitled: Student#_LASTNAME_FIRSTNAME_APSC100_Assi gnment1. 2. Text All text should be left justified. Do not use full justification. Paragraphs should not be indented and should, instead, be separated by a space. Use size 11 Calibri font. Edit your writing for spelling and grammar. Write as concisely as possible. 3. Title Page Include a title page with your name, student number, course number (APSC 100), and submission date. 4. Point of View The report should be written in 3rd person.
5 Do not use I or we.. 5. Headers/Page Numbers Use Word Header & Footer to insert a header, including your last name and the page number, positioned at the top right side of the page. Your name should be separated from the number using a vertical line, similar to Smith | 1 . The title page should not have a page number. Use Roman numerals (i, ii, iii, etc.) for the page numbers for the Table of Contents, List of Figures, and List of Tables pages. Arabic numbers (1, 2, 3, etc.) begin on the first page of the assignment and should be used for all subsequent pages (including appendices when applicable). 6. Headings Use Word Styles to consistently format your headings for sections and subsections. Each question and the references section should have its own heading. 7. Tables and Graphs Use consistent formatting for tables and graphs. Consider the following guidelines for effective graphics in a laboratory report: Tables 1.
6 Maximize white space. a. Eliminate vertical lines between cells. b. Where possible, minimize the number of horizontal lines between cells. 2. Centre text in cells. 3. Avoid using colour where possible. 4. Graphs 1. Do not include chart titles. Your figure caption should sufficiently introduce the contents of your graph . 2. Do include axis titles (with units). 3. Eliminate/Reduce horizontal and vertical gridlines when appropriate. Horizontal and vertical gridlines should only be included if they highlight key data points or are critical for making your graph more legible. 4. Avoid using colour where possible. 5. When inserting graphs into a report, make sure they are an appropriate size. Graphs/Figures should be as small as possible, while still remaining clear and legible to the naked eye (without zoom). It is appropriate to conserve space and place figures side-by-side if they are clear, legible, and their content is related.
7 8. Captions Include captions below figures and above tables using the Word Captions tool. Refer to each figure and table in the body of your report using cross-referencing, also found under the Word Captions tool. Use the Only Label and Number option when inserting cross- references such that the references appear as Table 1 or Figure 1 in the body of the report. 9. Table of Contents Use Word Table of Contents to generate a Table of Contents page from the headings. Note that Word will do this automatically provided that you have used styles for your section headings. 10. List of Figures/ List of Tables Use Word Captions to insert a List of Figures and List of Tables immediately after the Table of Contents page, generated from the captions used for your figures. The Table of Contents, List of Figures, and List of Tables should not be included in the Table of Contents.
8 11. References Use Word Citations & Bibliography to insert in text citations and add a references section to the end of your document. Reference all documents used. Citations must be in IEEE style. It is not mandatory that you use the Microsoft Word citation management tool. You are free to use other citations management tools ( Zotero). No citation management tools are perfect. It is always expected that you manually check that your citations are generated in proper IEEE format and that you make all necessary adjustments. 12. Significant Figures If not instructed otherwise, for the purposes of this assignment, report all numerical values to 4. significant figures. 5. 13. Numbering Equations Number all equations included in the body of the report. Any equations included should be referenced at least once by number in the explanatory text. It is not expected that students use Word Captions to generate equation captions, cross- references, or a List of Equations.
9 14. Sample Calculations Consider the following structure for effective sample calculations: I. Include the generic form of the equation. Ensure the equation is numbered. II. Define all variables. III. Substitute numeric values into the equation with units. IV. Report the final answer with units. 15. Units When reporting units, ensure there is a space between the numerical value and the unit. However, a space should not be left between the numerical value and the unit for percentages or degrees. Question 1: Specific Weight of Lake Ontario You and a fellow engineering friend own a beautiful boat. Recently, you have decided to move your boat from your seaside Newfoundland residence to Kingston. While out working on an APSC-100 assignment you notice that your boat is sitting lower in the lake water than it did on the Newfoundland coast, making you wonder about the differences in specific weights of water in Lake Ontario and the Atlantic Ocean.
10 Underwater pressure has a linear 6. relationship with the depth below the surface, given by the following: = + 0. where is the pressure (in kPa), is the specific weight of the lake water (in kN/m3), is the depth below the surface (in m), and 0 is the atmospheric pressure at the surface (in kPa). You decide to determine the specific weight of the water in Lake Ontario and compare it to the specific weight of ocean water with ocean = kN/m3. You have access to historical pressure data taken at two different depths in the lake from 30 years ago, but decide to make your own measurements as well. Your recent pressure measurements can be seen in Table 1. Both sets of data (historical and recent pressure) are gauge pressure measurements, meaning the measured pressures are taken relative to atmospheric pressure. Table 1: The recent pressure data taken from Lake Ontario at various depths.