Transcription of World Air Transport Statistics 2021
1 Since 1949 WAT SWorld Air Transport Statistics2021+ World Air Transport Statistics , Plus Edition 2021 ISBN 978-92-9264-350-8 2021 International Air Transport Association. All rights in CanadaMontreal GenevaNOTICEDISCLAIMER. The information contained in this publication is subject to constant review in the light of changing government requirements and regulations. No subscriber or other reader should act on the basis of any such information without referring to applicable laws and regulations and/ or without taking appropriate professional advice. Although every effort has been made to ensure accuracy, the International Air Transport Associ-ation shall not be held responsible for any loss or damage caused by errors, omissions, misprints or misinterpretation of the contents hereof.
2 Fur-thermore, the International Air Transport Asso-ciation expressly disclaims any and all liability to any person or entity, whether a purchaser of this publication or not, in respect of anything done or omitted, and the consequences of anything done or omitted, by any such person or entity in reliance on the contents of this publication. Opinions expressed in advertisements ap-pearing in this publication are the advertiser s opinions and do not necessarily reflect those of IATA. The mention of specific companies or products in advertisement does not im-ply that they are endorsed or recommended by IATA in preference to others of a similar na-ture which are not mentioned or advertised.
3 International Air Transport Association. All Rights Reserved. No part of this publication may be reproduced, recast, reformatted or trans-mitted in any form by any means, electronic or mechanical, including photocopying, recording or any information storage and retrieval sys-tem, without the prior written permission from:Deputy Director GeneralInternational Air Transport Association33, Route de l A roport1215 Geneva 15 AirportSwitzerlandSUMMARY OF PASSENGER AND CARGO TRAFFIC World scheduled passenger and cargo traffic by regionof airline domicile Revenue Tonne-Kilometres (millions)Share of Revenue Passenger- Kilometres by Airline TypePassenger and cargo traffic6 5 .1%Revenue Passenger-Kilometres (millions):2,986,993 Available Seat-Kilometres (millions):4,589, Tonne-Kilometres (millions): 231,342 Available Cargo Tonne-Kilometres (millions).
4 430,016 WAT S2021IN THIS VERSION OFTOP AIRLINES BY RPK AND CTKTop 10 Passenger (Revenue Passenger-Kilometres (millions)To p 1 0 C a r g o (Cargo Tonne-Kilometres (millions)American AirlinesChina Southern AirlinesDelta Air LinesUnited AirlinesChina Eastern AirlinesSouthwest Airlines*EmiratesAir ChinaRyanair*Qatar Airways123,997110,650106,488100,18888,72 887,26378,74671,41764,92857,17119,65614, 37113,7409,5698,1378,1047,3456,9776,5916 ,317 Federal ExpressUnited Parcel ServiceQatar AirwaysEmiratesCathay pacific AirwaysKorean AirCargoluxTurkish AirlinesChina Southern AirlinesChina Airlines* Airline has additional notes, please refer to Ranking Table LOAD FACTORPASSENGER LOAD FACTOROPERATING AND NET RESULTS(US$ millions)Net ResultOperating Result*Preliminary2013201420152016201720 1820192020*North America pacific East America 2.))
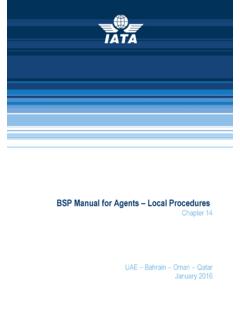
5 1%Low cost 25%Leisure 2%Traditional/Legacy 72%25,30035,45061,9626 0 ,14 456,60045,9474 3 ,15 9-105,00010,70 013 , 8 0235,9713 4 ,1913 7, 6 0 02 7, 25 026,366-126 , 4 0 0 Percentage of international scheduled Revenue Passenger-KilometresTRAFFIC BY ROUTE AREAP ercentage of international scheduled Cargo Tonnes-KilometresTRAFFIC BY ROUTE AREAE uropeNorthAmericaAsiaAfricaMiddleEastSou thwestPacificSouthAmericaCentral 6 % AmericaCaribbean7. 4%2 .1% .1% . 0 % RPKs growth% year-on-year World GDP growth% year-on-year -70-60-50-40-30-20-100102020202018201620 142012201020082006200420022000 Industry RPKsWorld GDP-21-18-15-12-9-6-3036 Industry Economic AnalysisAir Transport was strongly impacted by COVID-19, with limitedpassenger traffic, low revenues, and large financial losses, despiteresilient outcomes in air significantly limited air passenger travel in 2020 Air passenger traffic volumes were strongly impacted by the COVID-19 pandemic in 2020.
6 Industry-wide revenuepassenger-kilometres (RPKs) dropped by year-on-year. There were around passenger trips overall during decline in air passenger Transport in 2020 was the largest recorded since global RPKs started being tracked around1950. Since 1990, the long-run industry average growth rate had been around 5 5 % per pandemic also had an important impact on economic activity, with deteriorations in business and consumerconfidence, firms revenues, employment, and individual living standards among others. Indeed, GDP fell by globally,the largest fall in recent history. But the decline in RPKs was much larger than that of GDP, due to strict control measuresplaced on air travel, in particular 1: RPK versus World GDP growthSource: IATA, IMFWATS 20211 World Air Transport StatisticsChina domestic became the largest domestic air travel market COVID-19 crisis has led to domestic aviation markets being more resilient than international ones, as controlmeasures are typically less stringent within a country.
7 In consequence, global domestic RPKs dropped by year-on-year in 2020, while this was a fall for international RPKs. The market share of global domestic RPKs also grew from36% of industry-wide RPKs in 2019 to 54% in has however been a variety of outcomes among the main domestic markets worldwide. Several countries, notably inAsia, were able to limit the spread of COVID-19, allowing a cautious reopening of air Transport domestically, despite somevolatility linked to new outbreaks. This was for example the case of Vietnam the most resilient large domestic market in2020 South Korea, China and New Zealand. This means the large domestic China market flew close to 20% of globalRPKs in 2020, a significant rise from around 10% in other markets kept domestic travel mostly open despite experiencing more COVID-19 cases.
8 This was the case ofRussia, Iran and Mexico among others. In some cases, demand was supported by lower air fares and governmentcampaigns for tourism at home .The US domestic market was impacted by several strong waves of COVID throughout the year, as well as travelrestrictions to a degree, and RPKs were down compared to 2019. This has allowed domestic China to become thelargest domestic air travel market for the first time since data collection 2: Most resilient large domestic markets in share of 2020 Source: IATA DDSWATS 2021 WATS 2021 WATS 20212 Industry Economic several short-haul international markets saw some traffic as wellWhile traffic remained muted on most international markets, a few of them, such as Within Europe or certain routes toCentral America, showed signs of a recovery. This was limited to short-haul routes on relatively well integrated areashowever, as governments could more easily coordinate and because travellers felt more the large routes, Within Europe and North America Central America were the most resilient routes, but even onthose routes, traffic was down respectively and in 2020 compared to 2019.
9 On both routes, travel picked upduring periods when new COVID-19 infections were stable, before deteriorating again as new outbreaks started. Thisillustrates both the importance of reaching widespread vaccination to enable a restart, and the strong willingness to travelfrom individuals, in particular to leisure routes on which air travel did not significantly pick up include some of the largest pre-crisis markets, such asWithin asia ( lower than in 2019) and Transatlantic (down year-on-year). Low traffic volumes within Asiahighlights that even countries such as China or Australia where the pandemic has mostly been controlled cannotrestart international flights if neighbours or key partner markets have not been able to limit new COVID cases. The riskaversion of governments towards importing new variants of the virus also plays a crucial 3: Largest international RPK markets, 2020 Source: IATAWATS 2021 WATS 2021 WATS 20213 World Air Transport StatisticsTravel restrictions were a key driver of differences across marketsThe key drivers of air travel in 2020 have been those related to pandemic developments.
10 The number of new infections,testing regimes, travel bubbles and border openness have explained which markets performed strongly or poorly, with thepace of vaccination also playing a crucial role starting from the end of 2020. A large part of this information is summarizedby international travel stringency indices. Indeed, for markets that were open, willingness to travel has often remainedresilient, except for business Africa and the Middle East as well as to a lesser degree in North and Latin America travel constraints were lessstrict than elsewhere during the second half of the year, as governments there were less risk averse. This led to moreresilient traffic volumes in those asia pacific , COVID control measures have often remained stringent throughout the year, as governments did not wantto create new outbreaks after broadly succeeding in putting the pandemic under control in their countries.