Transcription of World Bank Commodities Price Data (The Pink Sheet)
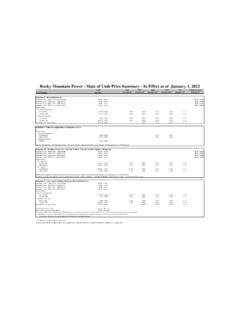
1 World Bank Commodities Price Data (The Pink Sheet) 2-Feb-2022. Annual Averages Quarterly Averages Monthly Averages Jan-Dec Jan-Dec Jan-Dec Oct-Dec Jan-Mar Apr-Jun Jul-Sep Oct-Dec Nov Dec Jan Commodity Unit 2019 2020 2021 2020 2021 2021 2021 2021 2021 2021 2022. Energy Coal, Australia $/mt a/ Coal, South Africa $/mt Crude oil, average $/bbl Crude oil, Brent $/bbl a/ Crude oil, Dubai $/bbl a/ Crude oil, WTI $/bbl a/ Natural gas, Index 2010=100 Natural gas, Europe $/mmbtu a/ Natural gas, $/mmbtu a/ Liquefied natural gas, Japan $/mmbtu a/ Non Energy Commodities Agriculture Beverages Cocoa $/kg b/ Coffee, Arabica $/kg b/ Coffee, Robusta $/kg b/ Tea, average $/kg Tea, Colombo $/kg b/ Tea, Kolkata $/kg b/ Tea, Mombasa $/kg b/ Food Oils and Meals Coconut oil ** $/mt b/ 736 1,010 1,636 1,317 1,483 1,682 1,521 1,860 1,961 1,696 2,016.
2 Fishmeal ** $/mt 1,448 1,433 1,481 1,460 1,484 1,501 1,497 1,441 1,440 1,423 1,429. Groundnuts $/mt 1,338 1,839 1,555 1,692 1,797 1,442 1,459 1,522 1,552 1,475 1,480. Groundnut oil $/mt b/ 1,407 1,672 1,878 . Palm oil ** $/mt b/ 601 752 1,131 918 1,014 1,073 1,129 1,307 1,341 1,270 1,345. Palmkernel oil ** $/mt 665 824 1,533 1,035 1,402 1,473 1,348 1,910 2,050 1,861 2,196. Soybean meal ** $/mt b/ 347 394 481 486 532 471 469 452 443 462 526. Soybean oil ** $/mt b/ 765 838 1,385 972 1,169 1,493 1,434 1,446 1,443 1,411 1,470. Soybeans ** $/mt b/ 369 407 583 488 580 620 581 552 551 554 606. Grains Barley $/mt b/ . Maize $/mt b/ Rice, Thailand 5% $/mt b/ Rice, Thailand 25% $/mt Rice, Thailand A1 $/mt Rice, Vietnam 5% $/mt Sorghum $/mt.
3 Wheat, , HRW $/mt b/ . Wheat, , SRW $/mt Other Food Bananas, EU $/kg Bananas, $/kg b/ Meat, beef $/kg b/ Meat, chicken $/kg b/ Meat, sheep $/kg . Oranges $/kg b/ Shrimp $/kg Sugar, EU $/kg b/ Sugar, $/kg b/ Sugar, World $/kg b/ continued on next page -1- World Bank Commodities Price Data (The Pink Sheet) 2-Feb-2022. Annual Averages Quarterly Averages Monthly Averages Jan-Dec Jan-Dec Jan-Dec Oct-Dec Jan-Mar Apr-Jun Jul-Sep Oct-Dec Nov Dec Jan Commodity Unit 2019 2020 2021 2020 2021 2021 2021 2021 2021 2021 2022. Raw Materials Timber Logs, Africa $/cum Logs, Asia $/cum b/ Plywood /sheets Sawnwood, Africa $/cum Sawnwood, Asia $/cum b/ Other Raw Materials Cotton $/kg b/ Rubber, RSS3 $/kg b/ Rubber, TSR20 $/kg Fertilizers DAP $/mt Phosphate rock $/mt b/ Potassium chloride $/mt b/ TSP $/mt b/ Urea, E.
4 Europe $/mt b/ Metals and Minerals Aluminum $/mt b/ 1,794 1,704 2,473 1,919 2,091 2,400 2,645 2,755 2,636 2,696 3,006. Copper $/mt b/ 6,010 6,174 9,317 7,185 8,477 9,706 9,382 9,703 9,729 9,551 9,782. Iron ore $/dmt b/ Lead $/mt b/ 1,997 1,825 2,200 1,904 2,014 2,128 2,333 2,326 2,330 2,302 2,332. Nickel $/mt b/ 13,914 13,787 18,465 15,957 17,618 17,359 19,112 19,770 19,933 20,016 22,355. Tin $/mt b/ 18,661 17,125 32,384 18,810 25,099 31,026 34,644 38,768 39,159 39,423 41,792. Zinc $/mt b/ 2,550 2,266 3,003 2,631 2,747 2,916 2,990 3,357 3,311 3,399 3,599. Precious Metals Gold $/toz c/ 1,392 1,770 1,800 1,875 1,798 1,815 1,789 1,796 1,822 1,790 1,816. Platinum $/toz c/ 864 883 1,091 939 1,160 1,182 1,023 1,000 1,038 945 994.
5 Silver $/toz c/ World Bank commodity Price indices for low and middle income countries (2010=100). Energy Non Energy Commodities Agriculture Beverages Food Oils and Meals Grains Other Food Raw Materials Timber Other Raw Materials Fertilizers Metals and Minerals Base Metals d/ Precious Metals Notes and Abbreviations: a/ Included in the energy index, b/ Included in the non-energy index, c/ Included in the precious metals index, d/ Metals and Minerals exluding iron ore. $ = US dollar bbl = barrel cum = cubic meter dmt = dry metric ton kg = kilogram mmbtu = million British thermal units mt = metric ton toz = troy oz .. = not available ** = see next page "Changes in the recent issues". continued on next page -2- Description of Price Series Coal (Australia), port thermal, Newcastle, 6000 kcal/kg spot Price .
6 Coal (South Africa), Richards Bay, NAR, 6,000 kcal/kg, sulfur less than 1%, forward month 1. Crude oil, average Price of Brent, Dubai and West Texas Intermediate, equally weighed. Crude oil, Brent 38 API. Crude oil, Dubai Fateh 32 API. Crude oil, West Texas Intermediate (WTI) 40 API. Natural Gas Index (Laspeyres), weights based on 5-year consumption volumes for Europe, US and Japan (LNG), updated every 5 years. Natural Gas (Europe), Netherlands Title Transfer Facility (TTF). Natural Gas ( ), spot Price at Henry Hub, Louisiana. Liquefied natural gas (Japan), LNG, import Price , cif; recent two months' averages are estimates. Cocoa (ICCO), International Cocoa Organization daily Price , average of the first three positions on the terminal markets of New York and London, nearest three future trading months.
7 Coffee (ICO), International Coffee Organization indicator Price , other mild Arabicas, average New York and Bremen/Hamburg markets, ex-dock. Coffee (ICO), International Coffee Organization indicator Price , Robustas, average New York and Le Havre/Marseilles markets, ex-dock. Tea, average three auctions, arithmetic average of quotations at Kolkata, Colombo and Mombasa/Nairobi. Tea (Colombo), Sri Lankan origin, all tea, arithmetic average of weekly quotes. Tea (Kolkata), leaf, include excise duty, arithmetic average of weekly quotes. Tea (Mombasa/Nairobi), African origin, all tea, arithmetic average of weekly quotes. Coconut oil (Philippines/Indonesia), crude, CIF Rotterdam. Groundnuts ( ), Runners 40/50, CFR Europe.
8 Fishmeal, German fishmeal, Danish 64% pro, FOB Bremen. Groundnut oil, crude, FOB South-East. Palm oil (Malaysia), RBD, FOB Malaysia Ports. Palmkernel Oil (Malaysia/Indonesia), crude, CIF Rotterdam. Soybean meal, Soybean pellets 48% pro, CIF Rotterdam. Soybean oil, Dutch soyoil crude degummed, EXW Dutch Mills. Soybeans, Gulf yellow soybean #2 CIF Rotterdam. Barley ( ) feed, no. 2, 20 days To-Arrive, delivered Minneapolis. Maize ( ), no. 2, yellow, US Gulf ports. Rice (Thailand), 5% broken, white rice (WR), milled, indicative Price based on weekly surveys of export transactions, government standard, Bangkok. Rice (Thailand), 25% broken, WR, milled indicative survey Price , government standard, Bangkok. Rice (Thailand), 100% broken, Super from 2006 onwards, government standard, Bangkok.
9 Rice (Vietnam), 5% broken, WR, milled, weekly indicative survey Price , Minimum Export Price , Hanoi. Sorghum ( ), no. 2 milo yellow, Gulf ports. Wheat ( ), no. 1, hard red winter, ordinary protein, export Price delivered at the US Gulf port for prompt or 30 days shipment. Wheat ( ), no. 2, soft red winter, export Price delivered at the US Gulf port for prompt or 30 days shipment. Bananas (Central & South America), major brands, free on truck ( ) Southern Europe, including duties. Bananas (Central & South America), major brands, US import Price , free on truck ( ) US Gulf ports. Meat, beef (Australia/New Zealand), chucks and cow forequarters, frozen boneless, 85% chemical lean, port (East Coast), ex-dock. Meat, chicken ( ) Urner Barry North East weighted average for broiler/fryer, whole birds, 2-1/2 to pounds, USDA grade "A".
10 Meat, sheep (New Zealand), frozen whole carcasses Prime Medium (PM) wholesale, Smithfield, London. Oranges (Mediterranean exporters) navel, EEC indicative import Price , Paris. Shrimp, ( ), brown, shell-on, headless, in frozen blocks, source Gulf of Mexico, 26 to 30 count per pound, wholesale US . Sugar (EU), European Union negotiated import Price for raw unpackaged sugar from African, Caribbean and Pacific (ACP), European ports. Sugar ( ), nearby futures contract, Sugar ( World ), International Sugar Agreement (ISA) daily Price , raw, and stowed at greater Caribbean ports. Logs (Africa), sapele, high quality (loyal and marchand), 80 centimeter or more, Douala, Cameroon. Logs (Southeast Asia), meranti, Sarawak, Malaysia, sale Price charged by importers, Tokyo.
