Transcription of World Greenhouse Gas Emissions in 2005
1 World Greenhouse Gas Emissions in 2005 . Tim Herzog World Greenhouse Gas Emissions in 2005 is a comprehensive view of global, anthropogenic Greenhouse gas (GHG) Emissions . The chart is July, 2009. an updated version of the original chart, which Overview appeared in Navigating the Numbers: One of the greatest challenges relating to global warming is that Greenhouse Gas Data and International Climate Greenhouse gases result directly or indirectly from almost every major Policy (WRI, 2005 ). human industry and activity. This chart, Global Greenhouse Gas Emissions in 2005 , shows these industries and activities, and the type and volume of Greenhouse gases that result from them.
2 It includes Emissions estimates from a range of international data providers, in an attempt to World Resources Institute Working Papers contain account for all significant GHG Emissions sources. preliminary research, analysis, findings, and recommendations. They are circulated without a full peer In 2005 , total GHGs are estimated at 44,153 MtCO2 equivalent (million review to stimulate timely discussion and critical feedback metric tons). CO2 equivalents are based on 100-year global warming and to influence ongoing debate on emerging issues.
3 Most potential (GWP) estimates produced by the IPCC. 2005 is the most recent working papers are eventually published in another form and year for which comprehensive Emissions data are available for every major their content may be revised. gas and sector. Comparison to 2000. The original version of this chart appeared in Navigating the Numbers: Suggested Citation: Herzog, Timothy. World Greenhouse Gas Greenhouse Gas Data and International Climate Policy (WRI, 2005 ). The Emissions in 2005 . WRI Working Paper. World Resources original chart used year 2000 data, the most recent year for which Institute.
4 Available online at comprehensive data were available at the time. Total global Emissions grew between 2000 and 2005 , an average of a year. However, individual sectors grew at rates between 40% and near zero, and there are substantial differences in sectoral growth rates between developed and developing countries. The remainder of this paper discusses the most significant changes in the chart compared to its previous release. World RESOURCES INSTITUTE 10 G Street, NE Washington, DC 20002 Tel: 202-729-7600 Fax: 202-729-7610 World Greenhouse Gas Emissions in 2005 .
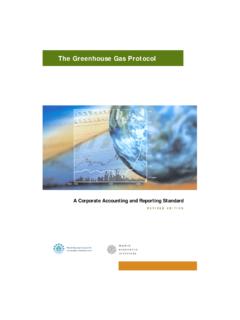
5 Total: 44,153 MtCO2 eq. Sector End Use/Activity Gas Road Transportation Air Rail, Ship, & Other Transport Residential Buildings World RESOURCES INSTITUTE.. Electricity & Heat World Greenhouse Gas Emissions in 2005 . Commercial Buildings July, 2009. Unallocated Fuel Combustion Iron & Steel Carbon Dioxide Aluminum/Non-Ferrous Metals Machinery (CO2) 77%. Pulp, Paper & Printing Other Fuel Food & Tobacco Combustion Chemicals E N E R G Y. Cement Industry Other Industry T&D Losses Coal Mining Fugitive Emissions Oil/Gas Extraction, Refining & Processing Industrial Processes (tropics only).
6 Deforestation Afforestation HFCs, PFCs, Land Use Change* Harvest/Management SF6 1%. Agricultural Energy Use Methane Agriculture Soils (CH4) 15%. Agriculture Livestock & Manure Rice Cultivation Other Agriculture Nitrous Oxide Landfills (N2O) 7%. Waste Wastewater, Other Waste Sources & Notes: All data are for 2005 . All calculations are based on CO2 equivalents, using 100-year global warming potentials from the IPCC (1996), based on a total global estimate of 44,153 MtCO2 equivalent. See Appendix 2 of Navigating the Numbers: Greenhouse Gas Data & International Climate Policy (WRI, 2005 ) for a detailed description of sector and end use/activity definitions, as well as data sources.
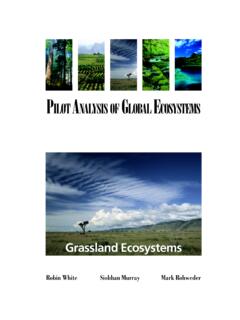
7 Dotted lines represent flows of less than percent of total GHG Emissions . * Land Use Change includes both Emissions and absorptions, and is based on analysis that uses revised methodologies compared to previous versions of this chart. These data are subject to significant uncertainties. 2. World Greenhouse Gas Emissions in 2005 3. Land Use Change In the latest chart, the most significant change (that Chart 1: Revisions to Estimates of Carbon Flux to the is, the activity on the chart that grew or shrank the Atmosphere from Land Use Change most) concerns the net contribution of atmospheric 2,500.
8 CO2 from land-use change. These data (for both Houghton et al, 2003. versions of the chart) come from research published 2,000. by Woods Hole Research Center, which was revised 1,500. MtC. in 2008. Revised rates of deforestation in the Houghton, 2008. 1,000. underlying Forest Resources Assessment (FRA) data produced significantly lower estimates of CO2 from 500. land use change compared to the previous research. 0. As a result, CO2 from land use change accounts for a 1960 1965 1970 1975 1980 1985 1990 1995 2000 2005 . significantly lower share of GHGs than in the Sources: Houghton, 2003, Houghton, 2008.
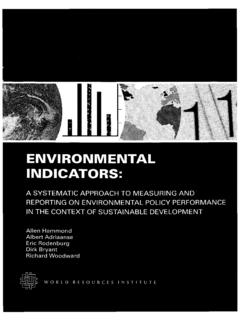
9 Original chart: as compared to The apparent decrease is entirely due to revised Chart 2: Global CO2 Emissions Growth in Select Sectors: methodologies used to calculate deforestation in the 2000- 2005 . underlying FRA data, and not to any actual decrease in deforestation rates. Chart 1 shows this distinction, in that the CO2 estimates from the latter study are lower than those from the previous study for every year past 1970. Houghton's revised data actually shows that CO2 Emissions from land use change grew between 2000 and 2005 .
10 It should be further noted that estimates of CO2 from land use change are still subject to large uncertainties. Studies cited by the IPCC 4th Assessment Report show error ranges of up to 2,933 MtCO2 ( GtC). at the global level in the 1990s (IPCC, 2007). Energy Sectors At the global level, Emissions grew in almost every Sources: IEA, 2007, CDIAC, 2008. Emissions in transportation, industry and sector and end use between 2000 and 2005 , the sole building use do not include grid electricity & heat attributed to those sectors. Emissions from industry do not include gas flaring or aluminum production.