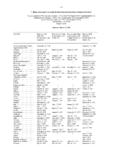
Transcription of World Intellectual Property Indicators 2019 -Patents - WIPO
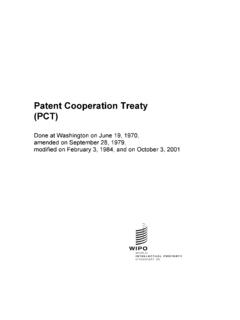
1 Patents1112 PatentsHighlightsPatent applications worldwide grew by in 2018 Applicants around the World filed million patent applications in 2018. This represents a increase on the previous year (figure ). Driving such strong growth was an exceptional number of filings in China, which received about 160,400 more filings in 2018 than it had in 2017. The next largest contributors were the European Patent Office (EPO) (7,812 additional filings) and the offices of the Republic of Korea (5,217) and India (3,473).The long-term trend shows patent applications grow-ing worldwide every year since 2004, with the sole exception of 2009 when they decreased by due to the financial the million applications filed worldwide in 2018, resident applicants filed million ( of the total), while non-resident applicant filed the remaining million ( ). Resident share increased from in 2004 to in 2018.
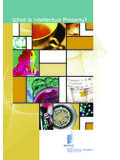
2 In addition, the proportion of resident versus non-resident filings varies greatly across offices. For example, more than half of all applications filed in the United States of America ( ) were non-resident applications, whereas non-resident share was less than a one-tenth of all applications filed in received million patent applicationsThe National Intellectual Property Administration of the People s Republic of China received million patent applications in 2018, an amount similar in magnitude to the combined total of the offices ranked from 2 to 11. The United States Patent and Trademark Office (USPTO) ranked second, with 597,141 applications. It was followed by the Japan Patent Office (JPO), with 313,567 applications, the Korean Intellectual Property Office (KIPO), with 209,992 applications, and the EPO, with 174,397 applications. Together, the top five offices accounted for of the World total in 2018, which is 10 percentage points higher than their combined 2008 share.
3 China s share of the World total increased from 15% in 2008 to in 2018, whereas that of the other four offices declined over the same composition and the ranking of the top 10 offices have both remained relatively stable since 2008. The composition of the top 10 offices has remained the same, except that in some years Australia has been among the top 10 offices, while in others it has lost its place in the list to Brazil. In addition, China moved up from third position in 2008 to take the top spot in 2011 and has continued to head the ranking for the past eight years. Figure shows the patent applications received by the top 10 offices, broken down by resident and non-resident filings. The Intellectual Property (IP) offices of China ( ), Germany ( ), Japan ( ), the Republic of Korea ( ) and the Russian Federation ( ) received the bulk of their applica-tions from resident applicants.
4 In contrast, Australia ( ), Canada (88%) and India ( ) reported a high share of non-resident applications filed worldwide reached Patent applications worldwide, 2004 201801,000,0002,000,0003,000,000 Applications2004 2005 2006 2007 2008 2009 2010 2011 2012 2013 2014 2015 2016 2017 2018 Application yearSource: Figure the top five offices, China (+ ), the EPO (+ ) and the Republic of Korea (+ ) recorded grow th in applications in 2018; in contrast, both Japan ( ) and the ( ) saw small long-term trend shows that the office of China has recorded year-on-year growth for the past 23 years. The EPO saw a second consecutive year of growth in 2018, while the Republic of Korea s office returned to growth following two years of decline in applications. The patent office of Japan has experienced either a fall in applications or negligible growth since 2005, mainly as a result of a persistent fall in resident applications.
5 The office saw its first decline in applications for nine years in the top 20 offices, 13 had a greater number of patent applications in 2018 than in 2017 (figure A9). The largest increases were in China, Hong Kong SAR (+ ), China (+ ), Singapore (+ ) and India (+ ). The increases in number of applications filed at three of these four offices were driven primarily by growth in non-resident applications. The exception was China, where a strong grow th in resident applications was the main driver of total the seven offices among the top 20 to have received fewer applications in 2018 than in 2017, the Islamic Republic of Iran ( ) repor ted the steepest decline, due mainly to a fall in resident applications. The United Kingdom ( ) ( ), Mexico ( ) and Brazil ( ) likewise recorded considerable annual drops. Applications in Brazil fell for a fifth consecutive year, while Mexico reported a third successive year of declining numbers of outside the top 20 offices to selected offices of low- and middle-income countries shows that Pakistan (+ ), Philippines (+ ), Uzbekistan (+ ), Morocco (+ ) and Vietnam (+ ) recorded particularly rapid growth in 2018.
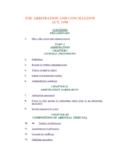
6 An increase in non-resident applications was the main driver of total growth in Morocco, the Philippines and Vietnam, whereas resident applications were the primar y driver in Pakistan and Uzbekistan (figure A11). The three regional offices the African Intellectual Property Organization (OAPI), the African Regional Intellectual Property Organization (ARIPO) and the Eurasian Patent Organization (EAPO) likewise reported strong growth in applications in 2018. Among the three, ARIPO (+ ) had the largest increase, followed by OAPI (+ ) and EAPO (+ ). At most of the offices of low- and middle-income coun-tries, the bulk of applications are filed by non-resident applicants. As a result, overall increases or decreases in applications received by these offices are determined mainly by the filing behavior of non-resident received of all patent applications filed worldwide Patent applications at the top 10 offices, 2018100,000200,000300,000400, ,400, of KoreaEPOG ermanyIndiaRussian FederationCanadaAustraliaRESIDENTNON-RES IDENTS ource: Figure Intellectual Property Indicators 2019 PatentsPatent filings since 1883 From 1883 to 1963, the patent office of the was the leading office for World filings.
7 Application numbers in Japan and the were stable until the early 1970s, when Japan began to see rapid growth a pattern also observed for the from the 1980s onward. Among the top five offices, Japan surpassed the in 1968 and maintained the top position until 2005. Since the early 2000s, however, the number of applications filed in Japan has followed a downward trend. Both the EPO and the Republic of Korea have seen increases each year since the early 1980s, as has China since 1995. China surpassed the EPO and the Republic of Korea in 2005, Japan in 2010 and the in 2011 and it now receives the largest number of applications worldwide. There has been a gradual upward trend in the combined share of the top five offices in the World total from in 2008 to in in patent applications for the top five offices, 1883 2018 200,000400,000600,000800,0001,000,0001,2 00,0001,400,0001,600,000 Applications1883 1890 1900 1910 1920 1930 1940 1950 1960 1970 1980 1990 2000 2010 2018 Application OF KOREAEPONote: The IP office of the Soviet Union, not represented in this figure, was the leading office in the World in terms of filings from 1964 to 1969.
8 Like Japan and the , the office of the Soviet Union saw stable application numbers until the early 1960s, after which it recorded rapid growth in the number of applications : Figure located in Asia received two-thirds of all applications filed worldwide in 2018Of the top 20 offices, nine were located in Asia, six in Europe, two each in North America and Latin America and the Caribbean (LAC), and one in Oceania. South Africa is the highest ranked African office, in 24th place. Offices located in Asia received over million appli-cations in 2018, representing of the World total (figure ). The combined total of Europe and North America was just below the 1 million mark. Asia s share of all applications filed worldwide increased from in 2008 to in 2018. This was primarily driven by strong growth in filings in China, which accounted for close to 70% of all applications filed in the region.
9 Offices in North America accounted for just under one-fifth of the 2018 World total, while those in Europe accounted for just over one-tenth. The combined share for Africa, LAC and Oceania was The shares of all the World s regions except Asia have gradually declined over the past decade due to the rapid growth in applications filed in among the top 20 list were 12 offices located in high-income, six in upper middle-income and two in lower middle-income distribution of applications by income group shows that for the first time offices of upper middle-income countries received more than half of all applications filed worldwide in 2018, while offices of high-income countries accounted for of the total (table A5). Over the past 15 years there has been a sizeable shift in the distribution of applications toward the upper middle-income group, which is largely explained by the strong growth in filings in China and a decline in Japan.
10 The share for offices of upper middle-income countries rose from in 2008 to in 2018; however, excluding China from the upper middle-income group shows the share of this income group to have remained stable at around 8% over the 2008 2018 located in Asia received of all patent applications filed Patent applications by region, 2008 and : Table application countApplications at regional IP offices are equivalent to multiple applications in the countries that are members of the organizations establishing those offices. In particular, to calculate the number of equivalent applications for the African Intellectual Property Organization (OAPI), the Eurasian Patent Organization (EAPO) and the Patent Office of the Cooperation Council for the Arab States of the Gulf (GCC Patent Office), each application is multiplied by the corresponding number of member states.