Transcription of WORST-CASE VERSUS RANDOM SAMPLING
1 INDUSTRIAL HYGIENE. EXPOSURE ASSESSMENTS: WORST-CASE VERSUS RANDOM SAMPLING . By Jerome E. Spear, CSP, CIH. T. he two types of SAMPLING strategies to consider when planning an exposure based on the central tendency and spread (or assessment study are WORST-CASE dispersion) of the sample distribution. Some SAMPLING and RANDOM SAMPLING . The broad RANDOM SAMPLING applications include the difference is that WORST-CASE SAMPLING involves following: more subjectivity than a RANDOM SAMPLING approach. o Describe the 8-hour time-weighted average (TWA) concentrations over In WORST-CASE SAMPLING , we non-randomly different days for a single worker or select the worker(s) who are subjectively SEG. believed to have the highest exposure(s). If no o Describe the 15-minute TWA. WORST-CASE sample exceeds the occupational concentrations over one workshift for a exposure limit(s), we are subjectively satisfied single worker or SEG.
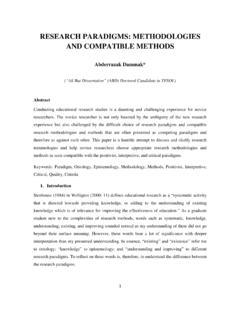
2 (but not statistically confident) that the exposure o Estimate the full-shift TWA. profile is acceptable. For example, plant concentration over one workshift based operators who have similar job duties within a on short-term (or grab) samples for a production unit of a plant may be identified as a single worker or SEG. similar exposure group (SEG). For such workers, a WORST-CASE exposure might occur on Table 1 provides a brief comparison of a worst - a day that their process unit generates the case SAMPLING strategy VERSUS a RANDOM highest production output. Such a day would SAMPLING strategy. subjectively be considered the WORST-CASE exposure period and targeted for evaluation. A RANDOM SAMPLING strategy requires workers within a SEG and the sample periods to WORST-CASE SAMPLING involves more subjectivity than a RANDOM SAMPLING be randomly selected.
3 Decisions on the acceptability of the exposure profile can then be determined with a known level of confidence approach.. Table 1 WORST-CASE VERSUS RANDOM SAMPLING SAMPLING Strategy Advantages Limitations WORST-CASE SAMPLING Fewer samples are typically collected to Relies on subjective judgments on worst - make a decision. case exposure conditions. Use of statistics is not required. Difficult to capture the actual WORST-CASE exposure period(s). Decisions on exposure acceptability are made without a known level of confidence. RANDOM SAMPLING Provides a method of characterizing the More samples are required in order to exposure group with a known level of profile the exposure group. certainty. Takes more time to interpret the SAMPLING Considered to be a more defensible results. strategy since the outcome is based on an objective analysis.
4 1. 2004 Spear Consulting, LLC. RANDOM sample is one where each worker and Exposure Profiling: time period has an equal probability of being selected for sample collection. It's important to An 8-Step Process collect the samples as randomly as possible;. otherwise, the resulting statistics will be S tatistically speaking, there's always a chance of making the wrong decision no matter how confident we are but by quantifying our level of certainty through a RANDOM SAMPLING strategy, biased. A RANDOM number table and/or the RANDOM number function in a spreadsheet computer program (such as Microsoft Excel). are useful tools in the RANDOM selection we are able to maximize our chance of making the process. Another consideration is, how many right decision. With the availability of computers samples should be collected in order for the and software programs available today, much of exposure profile to be useful?
5 The answer the statistical grunt work can be performed for us depends on a number of factors, including the making it easier to employ a RANDOM SAMPLING variability of the sample. However, AIHA. strategy. However, there are some statistical generally recommends between six and 10. terms and considerations that should be samples (AIHA, 106) are needed in order to understood, which are briefly described in the perform a baseline exposure profile. following 8-step process to exposure profiling. 3. Measure the exposures of the randomly 1. Identify the SEG to profile. The key selected workers and the randomly point in categorizing SEGs is to select the selected time periods. There are three exposure group in order to minimize the options in collecting the data hire an amount of variation among the samples; industrial hygiene consultant to be on site to otherwise, the resulting confidence collect the samples, collect the samples using intervals (calculated from the mean and internal staff, and/or augment your internal variance) will be too wide to be useful.
6 A staff with an industrial hygiene consultant SEG may be a single worker performing a where there are gaps in the required skills. single task; however, it is often impractical Samples do not necessarily need to be to perform RANDOM SAMPLING for each and collected by a Certified Industrial Hygienist (or every worker. So, a more practical a full-time industrial hygienists for that matter). approach is to include multiple employees However, if your internal staff lacks the skills in a SEG who have similar exposures. and understanding in developing a SAMPLING For example, employees assigned to strategy and/or SAMPLING methodologies, operate propane-powered lift trucks in a consider working with a consultant who can warehouse may be grouped as having provide one-on-one training and instruction (as similar potential exposures to carbon needed), assist with the development of the monoxide.
7 If there are multiple SEGs SAMPLING strategy, and/or assist with the identified (as most facilities have), a interpretation the SAMPLING data. method to prioritize the data collection needs can be devised. AIHA's A Strategy for Assessing and Managing Occupational 4. Calculate the following descriptive Exposures, provides a method for statistics: prioritizing SEGs (AIIHA, 89 101) for study based on the toxicity of the material, o Minimum The minimum value in the sample conditions of the workplace environment set. and their likelihood to influence o Maximum The maximum value in the exposures, and individual work practices sample set. that are likely to influence exposures. o Range The difference between the largest and smallest values in a sample set. o Percent above the OEL The fraction of the 2.
8 Randomly select workers and time periods sample set (in percent) that exceeded the within the SEG selected for study. A occupational exposure limit. 2. 2004 Spear Consulting, LLC. o Mean The arithmetic average of a set of data. 6. Calculate the following parametric o Median The measurement that divides a statistics: sample set into two equal parts. o Standard deviation The parameter for o Estimated arithmetic mean For a normal measuring the dispersion about the mean. distribution, the estimated arithmetic mean is o Geometric mean The median of the the same as the sample mean. However, for a lognormally distributed data. lognormal distribution, the arithmetic is o Geometric standard deviation The antilog different and must be estimated. of the standard deviation of the logtransformed o UCL1,95% of the arithmetic mean The data, which measures the variability for a UCL1,95% is the one-side upper confidence at a lognormal distribution.
9 95% confidence level. If the UCL1,95% is below the occupational exposure limits (OEL), we are Descriptive statistics characterize the sample's 95% confident that the long-term average distribution such as the central tendency ( , exposure is below the OEL. For evaluating mean, median, etc.) and the spread (such as the toxicants that produce chronic diseases, the range, standard deviation, variance, etc.). mean exposure should be examined (Rappaport and Selvin 378). o 95th percentile The value in which 95% of 5. Determine if the data fits a lognormal the population will be included. For example, and/or normal distribution. Parametric the median is the 50th percentile. statistics (such as upper and lower confidence o UTL95%,95% The upper tolerance limit of the limits and tolerance limits) are statistics that 95th percentile.
10 The UTL95%,95% is typically are calculated based on knowing (or used to examine acute (or short-term). assuming) a certain underlying distribution of exposures ( , fast-acting contaminants). the data set. The type of distribution ( , normal or lognormal) will generate different confidence intervals and tolerance limits. Most industrial hygiene SAMPLING data tends to follow a lognormal distribution. However, if the data follows neither a lognormal nor a normal distribution, the SEG should be redefined. One way to qualitatively determine if the underlying distribution follows a lognormal and/or normal distribution is to plot the data on probability paper. A major advantage of probability plotting is the amount of information that can be displayed in a compact form but it requires subjectivity in the deciding how well the model fits the data (Waters, Selvin, and Rappaport 493).