Transcription of www.aafa.org
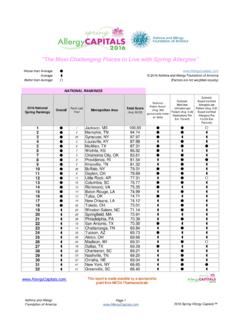
1 Asthma and Allergy Foundation of America Page 1 2015 Spring Allergy Capitals Worse than Average Average Better than Average 2015 Spring RankOverallRank Last YearMetropolitan AreaTotal Score (Avg. ) Subtotal: Pollen Score* (Avg. 300 grains/cubic meter air daily) Subtotal: Medicine Utilization per Patient (Avg. Medications Per Est. Patient) Subtotal: Board Certified Allergists per Patient (Avg. Board Certified Allergists Per 10,000 Est. Patients) 1 5 Jackson, 2 1 Louisville, 3 4 Oklahoma City, 4 2 Memphis, 5 16 Knoxville, 6 10 McAllen, 7 12 Wichita, 8 11 Dayton, 9 17 Providence, 10 8 Richmond, 11 21 Little Rock, 12 19 Tulsa, 13 3 Baton Rouge, 14 6 Chattanooga, 15 18 New Orleans, 16 14 Columbia, 17 9 Birmingham, 18 15 San Antonio, 19 7 Dallas, 20 27 Syracuse, 21 46 Greenville, 22 30 Charleston, 23 25 Nashville, 24 n/rWinston-Salem, 25 20St.
2 Louis, 26 49 Springfield, 27 31 Augusta, 28 75 Miami, 29 66 Virginia Beach, 30 34 Jacksonville, 31 47 Charlotte, 32 37 Toledo, 33 24 Greensboro, 34 42 Madison, 35 52 Tucson, 36 26 Buffalo, "The Most Challenging Places to Live with Spring Allergies" 2015 Asthma and Allergy Foundation of America(Factors are not weighted equally) This report is made possible by a sponsorship grant from Dymista and MEDA Pharmaceuticals Asthma and Allergy Foundation of America Page 2 2015 Spring Allergy Capitals 2015 Spring RankOverallRank Last YearMetropolitan AreaTotal Score (Avg. ) Subtotal: Pollen Score* (Avg. 300 grains/cubic meter air daily) Subtotal: Medicine Utilization per Patient (Avg.)
3 Medications Per Est. Patient) Subtotal: Board Certified Allergists per Patient (Avg. Board Certified Allergists Per 10,000 Est. Patients) 37 55 Omaha, 38 22 Philadelphia, 39 29 New Haven, 40 57 Des Moines, 41 13 New York, 42 85 Cape Coral, 43 51El Paso, 44 71 Albuquerque, 45 62 Las Vegas, 46 36 Grand Rapids, 47 39 Hartford, 48 32 Akron, 49 28 Houston, 50 33 Detroit, 51 44 Albany, 52 50 Austin, 53 69 Kansas City, 54 68 Rochester, 55 43 Bridgeport, 56 35 Youngstown, 57 41 Pittsburgh, 58 54 Fresno, 59 48 Allentown, 60 23 Columbus, 61 60 Atlanta, 62 58 Scranton, 63 80 Indianapolis, 64 40 Cleveland, 65 59 Tampa, 66 56 Phoenix, 67 61 Cincinnati, 68 83 Orlando, 69 63 Lakeland, 70 70 Harrisburg, 71 82 Riverside, 72 74 Milwaukee, 73 89 Worcester, 74 65 Minneapolis, 75 73 Baltimore, 76 53 Chicago, 77 93 Salt Lake City.
4 78 79 Boston, 79 38 Los Angeles, 80 96 Ogden, 81 81 Bakersfield, 82 67 Washington, 83 92 Seattle, 84 64 Raleigh, 85 n/rAbilene, 86 86 Sarasota, report is made possible by a sponsorship grant from Dymista and MEDA Pharmaceuticals Asthma and Allergy Foundation of America Page 3 2015 Spring Allergy Capitals 2015 Spring RankOverallRank Last YearMetropolitan AreaTotal Score (Avg. ) Subtotal: Pollen Score* (Avg. 300 grains/cubic meter air daily) Subtotal: Medicine Utilization per Patient (Avg. Medications Per Est. Patient) Subtotal: Board Certified Allergists per Patient (Avg. Board Certified Allergists Per 10,000 Est.)
5 Patients) 87 95 Boise, 88 87 Palm Bay, 89 84 Stockton, 90 78 San Jose, 91 n/rSpokane, 92 77 San Francisco, 93 94 Portland, 94 98 Denver, 95 91 Oxnard, 96 88 Sacramento, 97 n/rProvo, 98 100 Colorado Springs, 99 99 Daytona Beach, 100 97 San Diego, 2015 Rank - Rankings for the Allergy Capitals are based on analysis of data from factors including: Prevalence Data, Seasonal Pollen, Allergy Medicine Utilization per Patient, and the number of Board Certified Allergists per patient. Weights were applied to each factor and a composite final score was calculated for each Metropolitan Statistical Area (MSA).Total Score - Final total scores and subtotals were rescaled assigning 100 points to the largest score and presenting all other scores as a percentage of the largest.
6 The metro area with a total score of 100 points did not necessarily have the most severe" score for all factors, but, rather, the highest total weighted final score overall. Pollen Score* - Quantitative data analysis of average recorded pollen/mold spore levels and predicted prevalence for certain types of pollens/molds over the most recent spring season and the duration of the peak season for the most allergenic pollen types; this score also takes into consideration local prevalence statistics for people affected by allergies to pollen. (Regarding daily pollen counts: previous studies have shown that daily pollen concentrations of 150+ grains per cubic meter of airborne allergenic pollen is a sufficiently high concentration which can trigger allergy symptoms in a large percentage of the allergic population.)
7 Medicine Utilization per Patient Score - Quantitative data analysis of recorded per capita utilization of recorded pharmacy data for prescription (RX) allergy medicines in each metro area during the most recent spring season. Also includes over-the-counter (OTC) and behind-the-counter (BTC) allergy medication sales at the pharmacy counter. Board Certified Allergists per Patient Score - Quantitative data analysis for the most recent spring season of the number of Board Certified allergy and immunology specialists per 10,000 estimated patients. AAFA is solely responsible for the contents of this report. AAFA, Founded in 1953, is the leading national advocacy organization for the allergy community in the AAFA provides education, promotes advocacy and funds GOVERNMENTAL SOURCES:National Institute of Allergy and Infectious Diseases, National Institutes of Health, Allergic Rhinitis Information (2014) Department of Commerce, Bureau of the Census, Census 2000, 2013 Department of Commerce, National Oceanic and Atmospheric Administration, Air Resources Laboratory (ARL), Air Stagnation Climatology for the (2014) Environmental Protection Agency, Status and Trends, Latest Findings on National Air Quality (2014)NON-GOVERNMENTAL SOURCES.
8 Asthma and Allergy Foundation of America, "Asthma and Allergy Answers" (2015)American Board of Medical Specialties, Specialist Database (2014) INDUSTRY SOURCES:IMS/SDI Database (2014)IMS Medication Database (2014)This report is made possible by a sponsorship grant from Dymista and MEDA Pharmaceuticals