Transcription of (WY) Runoff Forecast (Apr-Sep) CO Capacity: 4.55 MAF
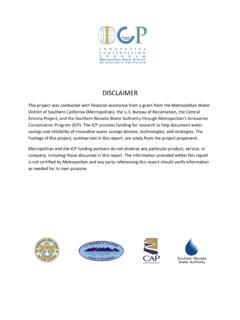
1 41% 38% WY CO UT AZ NM This report is produced by the water Resource Management Group and contains information from various federal, state, and local agencies. The Metropolitan water District of Southern California cannot guarantee the accuracy or completeness of this information. Readers should refer to the relevant state, federal, and local agencies for additional or for the most up to date water supply information. Reservoirs, lakes, aqueducts, maps, watersheds, and all other visual representations on this report are not drawn to scale. This report is best printed double sided on legal size paper ( " x 14") and folded in quarters 01234 Million Acre-Feet Calendar Year MWD Storage Reserve Levels Preliminary AccountingStorage BalanceEmergency Storage250350450550650750 Thousand Acre-Feet Diamond Valley Lake Storage Acre-Feet Lake Shasta Reservoir Storage 2017-20182018-20190510152025303540 water Content (in) Southern Sierra Snowpack 2017-20182018-2019 Normal91% 99% Statewide 159% 2019 SWP Allocation 669,025 AF 35% of Table A Flip Over for CRA Data Turn page for more SWP Data MAF OROVILLE 265 TAF CASTAIC 737 TAF DVL TOT: MAF SAN LUIS SWP: 1062 TAF 75% 82% Average EOM % Capacity Current Storage (% Capacity) % As of.
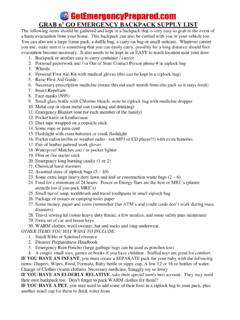
2 03/14/2019 Turn page for more CRA Data Flip Over for SWP Data MAF POWELL MAF MEAD FT 41% 38% Upper Colorado River Basin 139% 2019 Colorado River 938,903 AF 75% of full CRA 0102030128% " 351 TAF more in storage than this time last year in. 158% of normal No Data Less than 50 50 - 80 81 - 120 121 - 150 Greater than 150 Snow water Equivalent (% of Normal) Snowpack % of Normal 0153045607590136% WY Avg 8 STA: " 01530456075134% WY Avg 5 STA: " 061218154% WY Avg LA: " 061218142% WY Avg SD: " Record Low: 587 TAF (08/01/1977) Record Low 810 TAF 325 TAF MAF MAF MAF MAF % Normal WY to Date WY Avg % Rainfall to Date (in) Capacity: MAF Capacity: 810 TAF Does not include storage withdrawals 106% 141% 129% 135% 158% 155% 143% 132% 156% 166% 157% Southern Sierra 158% Northern Sierra 154% water Supply Conditions Report water Supply Conditions Report As of.
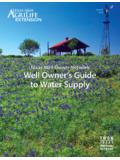
3 03/14/2019 13 TAF more in storage than this time last year Highlights Northern Sierra snowpack is at 154% of normal Upper Colorado River Basin snowpack is at 139% of normal Southern California precipitation above normal - Los Angeles (154% of normal) and San Diego (142% of normal) Colorado River Resources As of: 03/14/2019 05101520253035404550 water Content (in) Northern Sierra Snowpack 2017-20182018-2019 Normal34% 105% 54% 148% 265% 67% 04812162024 Precipitation (in) 8 Station Index Precip Average Monthly PrecipActual Precip to Date0510152025 water Content (in) Upper Colorado Basin Snowpack Acre-Feet Oroville Reservoir Storage 2017-20182018-2019 Enhanced Flood Pool (Wet Index)Original Flood BoundariesRecord Low: 882 TAF (9/7/1977) Acre-Feet San Luis Reservoir Storage Total storage 2018-2019 SWP storage 2018-2019 Total storage 2017-2018 SWP storage 2017-2018 8101214161820 Million Acre-Feet Lake Powell Storage 81012141618 Million Acre-Feet Lake Mead Storage Surplus Shortage Trigger 36% 154% 33% 118% 239% 84% 048121620 Precipitation (in) 5 Station Index Precip Average Monthly PrecipActual Precip to Date136% 92% 67% 122% 143% 129% 0246 Precipitation (in) Average Monthly PrecipActual Precip to DateUpper Colorado Basin Precip Lake Mead Shortage/Surplus Outlook Likelihood based on results from the January 2019 MTOM/CRSS model run.
4 In. water Year to Date MAF less in storage than this time last year MAF more in storage than this time last year 051015202530354045 Million Acre-Feet water Year Sacramento River Runoff 035810131518 Million Acre-Feet water Year Powell Unregulated Inflow Long Term Average Long Term Average Colorado River Resources As of: 03/14/2019 in. water Year to Date 20192020202120222023 Shortage0%69%82%81%79%Surplus0%0%0%1%4%2 67 TAF more in SWP storage than this time last year Other SWP Contract Supplies for 2019 (AF) Article 2150,000 Carryover147, in. water Year to Date 98 TAF more in storage than this time last year in 139% of normal in. 154% of normal 2019 Colorado River Ag Use Acre-Feet Date of Forecast IID/CVWD (QSA Priority 3a) WY 2019 of normal Capacity: MAF Capacity: MAF Capacity: MAF Capacity: MAF 92% State water Project Resources As of: 03/14/2019 WY 2019 of normal 127% SWP Capacity MAF Total Capacity MAF ( Forecast ) ( Forecast ) 400420440460480 JFMAMJJASONDT housand Acre-Feet Date of Forecast PVID/Yuma (QSA Priority 1 & 2) Relative to QSA Threshold +20 0 -20 +40 +60 Forecast (as of March 2019) Forecast (as of March 2019) This table will be updated once Reclamation publishes the next 24-month study in April 2019.
5