Transcription of Y.K. Chan Hedging the Volatility Skew (212) 816-8337
1 February 23, 2001 Bond Market Roundup: Strategy25 Hedging the Volatility SkewAmong the risk factors that determine mortgage prices are the quoted volatilities ofoptions on swaps. A high level of implied Volatility means a more expensive hedge formortgages, hence a cheaper valuation. Large Volatility exposure of a portfolio can bereduced with swaptions. However, mortgage portfolio managers sometimes intend totake a position in market volatilities, when they are historically high and are expected todecrease. At other times, the Volatility exposure might be significant, but not highenough to justify the transaction costs and management efforts involved in the use ofoptions.
2 In these cases, it is useful to examine whether duration hedges with interest-ratebenchmarks can be improved by exploiting the correlation of the Volatility and ratelevels, if such a correlation exists and can be illustrate, consider a mortgage-backed security with an effective duration of hedged with the ten-year Treasury note. For simplicity, assume that the Treasurynote has a duration of The hedge ratio is accordingly 5/7= Suppose thesecurity has a Volatility duration of In other words, for every increase of 1% Volatility the bond loses of its value.
3 Now, if we believe that every 100bp rallyof the ten-year rate would be accompanied by an increase of 2% Volatility , then itbehooves us to adjust the Hedging ratio to compensate for the anticipated pricechange resulting from the Volatility change. Accordingly, the proper Hedging ratiowould be (5-2* )/7= immediately raises a question: Is there any evidence to support the belief thatrate moves have predictive power on Volatility moves?The answer seems to depend on the time period. In some years there was a very strongcorrelation in other years, none.
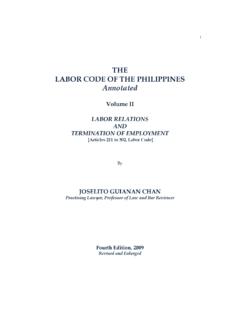
4 Figure 25 plots the quoted Black Volatility of five-into-ten swaptions against the ten-year Treasury rate for the period since January 26 and 27 are similar plots for the years 1999 and 1998, Thedrastically different shapes of these plots clearly suggest that any estimation ofcorrelation should be done in such a way that a change in regime is detected 25. Volatility of 5x10 Swaption Versus the Ten-Year Treasury Rate (Jan 00 Present) Rate (%)Implied Volatility (%)13 Feb 013 Jan 00 Source: Salomon Smith Barney. 9 Despite appearances, these graphs have nothing to do with the Human Genome Chan(212) 23, 2001 Bond Market Roundup: Strategy26 Figure 26.
5 Volatility of 5x10 Swaption Versus the Ten-Year Treasury Rate (1999) Rate (%)Implied Volatility (%)4 Jan 9931 Dec 99 Source: Salomon Smith 27. Volatility of 5x10 Swaption Versus the Ten-Year Treasury Rate (1998) Rate (%)Implied Volatility (%)2 Jan 9831 Dec 98 Source: Salomon Smith there are sophisticated tools designed to predict Volatility in a time series,here we test the performance of a simple rolling regression scheme. For each daysince January 2, 1998, we regress the past moves in Volatility on the correspondingmoves in rate.
6 We use exponential weighting with a mean decay time of threemonths, so that data in the distant past is given little weight. The choice of threemonths as the mean decay time is with the hope that it is long enough for asignificant estimate of correlation, yet short enough to adjust to the nonstationarycharacteristics of the Volatility series so prominent in Figures 25 through 27. Theregression coefficient, commonly called the Volatility skew in the current context, isused to predict the next day s Volatility move, conditioned on the rate move.
7 Thestandard deviation of the residual errors is compared to that of the actual are tabulated in Figure 23, 2001 Bond Market Roundup: Strategy27 Figure 28. Predicting Volatility SkewAverage skew ;Standard DeviationStandard DeviationPeriodVol Increase per 100bp Rallyof Vol Movesof Residual 13, : Salomon Smith Figures 25 through 27, the skew coefficient is far from , the exponentially weighted scheme, with three-month decay time, atleast seems to limit the error from an obsolete skew so that the residual error is nolarger in standard deviation than the actual moves.
8 In the past year, there is actuallynoticeable improvement in using the prediction. The estimated skew coefficienttoday, Volatility per 100bp rally, is significantly higher than indicated byquotes on out-of-the-money constant-maturity options on swaps, the lattertranslating to approximately should the investor do? Quotes for out-of-the-money and in-the-moneyoptions may be a good indication of the skew . However, in that regard there is aquestion as to whether the market quotes contain a large part of risk premium, whichdoes not reflect expectation.
9 Market quotes are important information for derivativespricing, but not necessarily for anticipating moves. As an alternative to quotes forout-of-the-money and in-the-money options, the rolling regression seems either proves useful for the next 100bp rally, only time can the meantime, the above idea can be applied to other risk factors, as has beendone by various researchers. The more immediate risk factors are the other keyrates: the two-, five- and 30-year rates. Others factors include swap spreads, thecurrent-coupon OAS, and, for investors in CMO derivatives, the OAS of IOs andPOs.
10 Given a move in the ten-year rate, a good prediction of these other risk factorscould improve on the effective-duration hedge (in a manner similar to theadjustment for the Volatility skew mentioned previously). Generally, given moves inthe several key Treasury rates, a good prediction of the remaining risk factors wouldimprove the performance of partial-duration hedges. Indeed, the adjustment forvolatility skew should be done in conjunction with all the other risk factors. We willdiscuss this in a future GNMA ARMs Are AttractiveWith the mortgage rates close to two-year lows and with an anticipated semi-refinancing wave, it is important to focus on the advantages of seasoning in though actual gross WACs, reset schedules, gross margins, etc.