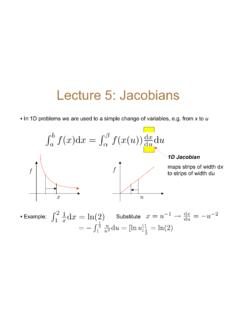
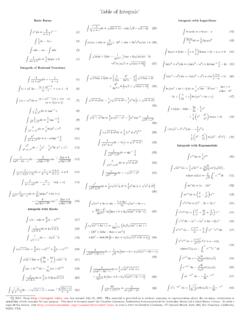
Transcription of YULE’S “NONSENSE CORRELATION” SOLVED!
1 The Annals of Statistics2017, Vol. 45, No. 4, 1789 1809 Institute of Mathematical Statistics, 2017 yule S nonsense CORRELATION SOLVED! BYPHILIPA. ERNST ,LARRYA. SHEPP , 1 ANDABRAHAMJ. WYNER Rice University and University of Pennsylvania In this paper, we resolve a longstanding open statistical problem. Theproblem is to mathematically prove yule s 1926 empirical finding of non-sense correlation [J. Roy. Statist. (1926) 1 63], which we do byanalytically determining the second moment of the empirical correlation co-efficient := 10W1(t)W2(t) dt 10W1(t) dt 10W2(t) dt 10W21(t) dt ( 10W1(t) dt)2 10W22(t) dt ( 10W2(t) dt)2,of twoindependentWiener processes,W1,W2. Using tools from Fredholmintegral equation theory, we successfully calculate the second moment of toobtain a value for the standard deviation of of nearly The nonsense correlation, which we call volatile correlation, is volatile in the sense thatits distribution is heavily dispersed and is frequently large in absolute is induced because each Wiener process is self-correlated in time.
2 Thisis because a Wiener process is an integral of pure noise, and thus its valuesat different time points are correlated. In addition to providing an explicitformula for the second moment of , we offer implicit formulas for highermoments of .1. fundamental yet crucial question for practitioners ofstatistics is the following: given a sequence of pairs of random variables{Xk,Yk}(k=1,2,..,n), how can we measure the strength of the dependence ofXandY?The classical Pearson correlation coefficient offers a solution that is standard andoften powerful. It is also widely used even in situations where little is known aboutits empirical properties, for example, when the sequence of random variables arenot identically distributed or independent. The Pearson correlation is often calcu-lated between two time series. Practitioners have developed many rules of thumb to help interpret these values ( , a correlation greater than is generally un-derstood to be large).
3 Such correlations can be difficult to interpret [16]. It is wellknown that a spurious correlation will be observed when two time series arethemselves dependent on an unobserved third time , it is less well known to some practitioners that one may observe volatile correlation in independent time series. The correlation is volatile in thesense that its distribution is heavily dispersed and is frequently large in absoluteReceived February 2016; revised August on April 23, subject 60J65, 60G15; secondary words and correlation, Wiener processes, integral A. ERNST, L. A. SHEPP AND A. J. WYNER value. yule observed this empirically and, in his 1926 seminal paper [16], calledit nonsense correlation, asserting that we sometimes obtain between quanti-ties varying with time (time-variables) quite high correlations to which we cannotattach any physical significance whatever, although under the ordinary test thecorrelation would be held to be certainly significant.
4 Yet yule s empirical findingremained isolated from the literature until 1986 (see [1]), when the authors of [6]and [12] confirmed many of the empirical claims of spurious regression madeby the authors of [5]. In particular, [12] provided a mathematical solution to theproblem of spurious regression among integrated time series by demonstrating thatstatistical t-ratio and F-ratio tests diverge with the sample size, thereby explainingthe observed statistical significance in such regressions. In later work [13], thesame author provided an explanation of such spurious regressions in terms of or-thonormal representations of the Karhunen Lo ve this work, we will use the word volatile in lieu of nonsense . Weemphasize that volatile correlation is distinctly different from spurious correla-tion, as the latter refers to a third time series, whereas the former does not.
5 DespiteYule s empirical findings, it is often (erroneously) assumed that a large correlationbetween such pairs must have a cause (see [10]) when they definitionally do , for example, thatXi=SiandYi=S iwhereSiandS iare the partialsums of two independent random walks. The empirical correlation is defined inthe usual way as( ) n= ni=1 SiS i 1n( ni=1Si)( ni=1S i) ni=1S2i 1n( ni=1Si)2 ni=1(S i)2 1n( ni=1S i) , it is sometimes (erroneously) assumed that for large enoughnthesecorrelations should be small. Indeed, large values are quite probable. The his-togram of the empirical correlation of independent random walks is widely dis-persed over nearly the entire range. This was recently mentioned by [11], whichpresents (usingn=149) a critique of efforts to reconstruct the earth s historicaltemperatures using correlated time series. We reproduce the histogram here as Fig-ure1, withn=10, histogram reports that the middle 95% of the observed correlation coeffi-cients fall in the interval[ , ].
6 The lesson to be learned from Figure1is that correlation is not always a useful statistic; in the case of two independentrandom walks, the observed correlation coefficient has a very different distributionthan that of the should be noted that the statistic which uses theactual ran-dom variables,Xk,X kinstead of their partial sums, kj=1Xj, kj=1X jdoesnot produce volatile correlation. Indeed, asn , if the random variables,Xk,X k,k=1,..are sequences, independent of each other, with positiveYULE S nonsense CORRELATION solved ! empirical correlation of partial sums of two independent random walks withn=10, variances, then n=1n nk=1 XkX k (1n nk=1Xk)(1n nk=1X k)( 1n nk=1X2k (1n nk=1Xk)2)( 1n nk=1X2k (1n nk=1Xk)2)is easily seen to tend to zero (by the law of large numbers). This shows that thevolatile correlation is a consequence of using the partial sums in place of the vari-ables themselves.
7 The reason that the partial sums are self-correlated (and therebyinduce large correlation) seems related to the arcsine law. The history of Sparre An-dersen s major combinatorial contribution to the proof of the arcsine law (see [4])raises the question of whether a formula for discrete sequences of partial sums canbe derived by combinatorial methods employing cyclic permutations. This wouldbe very elegant, and would greatly simplify earlier works of Erd os and Kac (see[3 ]), but seems lieu of considering the volatile correlation between two independent randomwalks, we consider the continuous analog, namely that of two independent Wienerprocesses. Although it would be ideal to find the full analytical distribution ofthe empirical correlation between two independent Wiener processes, finding thesecond moment itself suffices as formal confirmation of yule s nonsense corre-lation.
8 But such evidence, until now, has remained , letWi(t),0 t 1,i=1,2 denote two independent Wiener pro-cesses on[0,1]. We analytically find the second moment of the empirical correla-1792P. A. ERNST, L. A. SHEPP AND A. J. WYNERTABLE1 Moments of obtained from10,000 Monte Carlo iterationsE[ 0]E[ 1]E[ 2]E[ 3]E[ 4]E[ 5]1 [ 6]E[ 7]E[ 8]E[ 9]E[ 10] betweenW1(t)andW2(t), where the empirical correlation is defined as( ) = 10W1(t)W2(t) dt 10W1(t) dt 10W2(t) dt 10W21(t) dt ( 10W1(t) dt)2 10W22(t) dt ( 10W2(t) dt)2,the limit to which nconverges weakly, as originally shown in [12]. Using toolsfrom integral equation theory, we successfully calculate the second moment of to obtain a value for the standard deviation of of nearly This volatilecorrelation is induced because each Wiener process is self-correlated in is because a Wiener process is an integral of pure noise and thus its values atdifferent time points are correlated.
9 The correct intuition for the occurrence of thisphenomenon is that a Wiener processself-correlated, and thus volatile correlationis indeed induced between the independent Wiener course, it is rather simple to simulate the distribution of .Wedosobelowusing a simple Monte Carlo routine. The result of averaging 10,000 simple MonteCarlo iterations of the first ten moments of can be found above in validity of the Monte Carlo can be justified by noting that the odd momentsshould all be zero, since is symmetric. The impact of this problem for practi-tioners of statistical inference, however, renders it most deserving an analyticalsolution, and this serves as our paper s primary structure of the paper is as follows. In Section2, we present results neededfor obtaining the distribution of . In Section3, we provide implicit formulas forall moments of . Most significantly, we explicitly obtain the following expressionfor the variance of by comparing coefficients ofz2, which we show (in ) are given by the following double integral: 0du1 u10 u1u2sinhu1sinhu2u1u2u1+u2 (1u21(1 u1sinhu1coshu1) 1u22(1 u2sinhu2coshu2)u1 u2) it is not possible to calculate the double integral above in elementaryterms, it has removable singularities and shockingly converges very nicely at allpoints where any ofu1,u2oru1 S nonsense CORRELATION solved !
10 17932. A few results needed for obtaining the distribution of .In ,we rewrite in an alternate form that will be useful in Section3. The alternateform involves stochastic integrals rather than integrals of a Wiener process , we introduce the functionF, which is well suited to calculating themoments of . Furthermore, we explicitly . Magnus [9] gave the moments of the ratio of apair ofquadratic formsin normal variables. Our work gives a method for the correlationcoefficient which is a ratio involvingthreequadratic forms of normal variables aswell as square roots. The three-form problem solved here requires a new begin this task by rewriting .Recall the definition of empirical correlation written in equation ( ). Notingthatmi:= 10Wi(t) dt, i=1,2 are the empirical mean values, we rewrite as( ) = 10(W1(t) m1)(W2(t) m2)dt 10(W1(t) m1)2dt 10(W2(t) m2) equation ( ), it is easy to see, by Cauchy Schwarz, that 1 have the equality( ) =X1,2 X1,1X2,2,where( )Xi,j= 10 10(min(s1,s2) s1s2)dWi(s1)dWj(s2).