Transcription of z score info
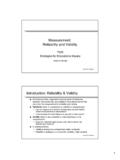
1 Z - Scores Why is this Important? How do you compare apples and oranges? Are you as good a student of French as you are in Physics? How many people did better than you on a test? How many did worse? Are you abnormal or deviant? Dr So and So, are you going to curve the exam? If you are going to understand a situation, you will need to able compare things. You will need to present the comparisons in a way that facilitates decision-making. You may be asked: sWhat percentage of people falls below a given score ? sWhat is the relative standing of a score in one distribution versus another? sWhat score or scores can be used to define an extreme or deviant situation? You can do all of these with the Z - score !
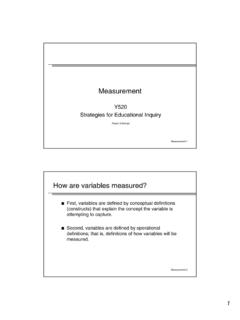
2 Data Types For our discussion of the Z-scores, we will be using measurement data (numerical scores). We Will Need: Measures of central tendency: The Mean Measures of variability Standard Deviation Our First Intuitive Example You enter your dorm room and find that one of your roommates has a happy face: But your other roommate is sad: What's happened! Why are you so happy! But why are You so sad? They reply: TTThhheeeyyy hhhaaavvveee ttthhheee sssaaammmeee ssscccooorrreee!!! WWWhhhyyy ttthhheee dddiiiffffffeeerrreeennnttt rrreeeaaaccctttiiiooonnnsss!!! As a student, you probably have figured out that the 58 on the French test is bad compared to every one else and that the 58 on the Physics test may be pretty good compared to everyone else.
3 Hurray, I got a 60 on the Physics test!!! Wah!, I got a 60 on the French test!!! Our physics major roommate, says "That great old Prof. - she curved the test!". We need to be more precise - To do that we need to review the Gaussian Distribution! That's how we will compare the French and Physics tests. Finding Yourself on the Gaussian Curve Remember the Gaussian curve. It is the shape that quite a lot of measurement data distributions have. That means that the frequency of the scores tend to fall in a very specific shape. Mean The Gaussian curve is described by its mean (average) and standard deviation. Hints: This is the Gaussian curve and the line in the middle is the mean.
4 Mean - X/N or the average. Many frequency distributions in Psychology are normal. A little box on the graph represent a score . In our case it will be an exam score of a particular individual. The red arrow represents the standard deviation. A measure of the width of a measurement data distribution [[[[ ((((X-mean)2/N] SSOO WWHHAATT DDOOEESS TTHHIISS HHAAVVEE TTOO DDOO WWIITTHH TTHHEE FFRREENNCCHH AANNDD PPHHYYSSIICCSS TTEESSTT!! TTHHEE BBIIGG IIDDEEAA!!!! Standard Deviation WWHHEERREE YYOOUU AARREE IINN TTHHEE DDIISSTTRRIIBBUUTTIIOONN DDEETTEERRMMIINNEESS HHOOWW WWEELLLL YYOOUU DDIIDD!! 60 French Mean 50 60 70 Physics Mean Because the Physics test was very difficult with a mean of 50, one roommate did better than most ( score of 70) in the class as was quite pleased with herself.)))]]]
5 You can see that most people in the distribution are below her. It is the opposite for our French-taking roommate. She is scored below most. TTHHEE 22 NNDD BBIIGG IIDDEEAA!!!! We can quantify your place in the distribution. You don t have to draw a picture every time. We will do this with the Z- score . TTHHEE 33 RRDD BBIIGG IIDDEEAA!!!! The Standard Deviation is a Ruler. Consider the Z - score as the Inch Marks of the Ruler. A Z- score Equals the Number of Standard Deviations, the score is from the Mean ZZZ === (((SSScccooorrreee --- MMMeeeaaannn)))/// SSStttaaannndddaaarrrddd DDDeeevvviiiaaatttiiiooonnn TTHHEE CCOONNCCEEPPTT LLLeeettt sss LLLooooookkk aaattt ttthhheee PPPhhhyyysssiiicccsss TTTeeesssttt!
6 !! We know its mean is 50. The Standard Deviation is calculated to be 10 (someone used their calculator). Remember the SD is the distance from the Mean from to the Point of Inflection (change in direction of the curve) TTHHEE 44 TTHH BBIIGG IIDDEEAA!!!! What s our Physics Freak Roommate s Z - score And Why is She Happy! Rulers Your School Bag 12 Inches Long Marked in Inches Center is 6 " Normal Curve 100% of the Scores Marked in Z-Scores Center is the Mean Mean = 50 Roommate score = 60 10 Points = 1 SD 2 SDs = 20 points 1. The roommate s score is 10 points above the mean or one SD above the mean. 2. Her Z - score Equals 1 because: ZZZ === (((SSScccooorrreee --- MMMeeeaaannn)))///SSSDDD ZZZ === (((666000 --- 555000))) /// 111000 ZZZ === 111 3.
7 Let s do it again! The student down the hall runs in to our gang s room. She yells - I got a 84!! Yahoo! 2. Her Z - score Equals because: ZZZ === (((SSScccooorrreee --- MMMeeeaaannn)))///SSSDDD ZZZ === (((888444 --- 555000))) /// 111000 ZZZ === This is a bright young person. Let s look at the Z- score ruler on the Gaussian Curve. She gets a very big happy face SSShhheee sss dddooonnneee bbbeeetttttteeerrr ttthhhaaannn aaalllmmmooosssttt eeevvveeerrryyyooonnneee iiinnn ttthhheee ccclllaaassssss!!! Oh, Dear - Now we know we our French Taking Room mate is Sad! ZZZ === (((666000 --- 777000))) /// 111000 ZZZ === Her Z - score in negative and below the mean.
8 NNNuuuaaannnccceeesss AAAbbbooouuuttt ttthhheee ZZZ---SSScccooorrreee::: 1. The Z - score can be positive or negative. Positive is above the mean. Negative is below the mean. 2. The Mean of the Z scores is Zero. If you got the class average on a test - your Z - score = 0. Because Z would be (Mean-Mean)/0 = 0. 3. The Standard Deviation of the Z distribution = 1. We will discuss this later. AA RREEAALLLLYY BBIIGG CCOONNCCEEPPTT!! ZZ --SSCCOORREESS CCAANN BBEE TTUURRNNEEDD IINNTTOO PPEERRCCEENNTTAAGGEESS Here s the deal - if you know a Z- score - you know what percent or proportion of scores are above and below that score . It s like slicing a pie. Cut it in quarters and you know that each quarter as 25% of the pie.
9 Let s slice the Gaussian Curve The distribution holds 100% of the scores or a proportion of The gray line cuts it in half. So - half are below and half above. If you received the average score on the test (Z = ), you did better than 50% of the class. What about cutting the distribution in another place? Calculus types have calculated the percents above and below any Z- score . We mentioned this is Intro to Stats #1. You statistics book has a table with this information in it. SSSooommmeee EEExxxaaammmpppllleeesss::: Our Physics Students: 1. The score of 60 was 1 Standard Deviation (Z= ) above the mean. The table would tell me that there are of scores below. 2. The score of 84 was SDs above the mean (Z = ).
10 The table tells me that there were scores below it. No wonder these kids are happy. 50% below below me > Our Poor French Student: The score of 60 was1 SD below the mean (Z = - ) The table would tell me that there were scores above it You can do this with any score if you have a Gaussian distribution. More Nuances: 1. There are many variants of this procedure: A. Deviation Problem What s in Your Tails? - Huh? Let's go back to the Physics Test. Your are the professor and the chair of the department wants to know what scores cut off the top 5% of the students and the lowest 5 %. The former get an award and the latter get a scolding! HHeerree ss tthhee AAnnsswweerr I looked up the Z - score that cuts off 5 % in the tails.