
A.1 SAS EXAMPLES
logistic regression model with a binary indicator as a predictor. PROC LOGISTIC uses FREQ to weight counts, serving the same purpose for which PROC FREQ uses WEIGHT. The BARNARD option in the EXACT statement provides an unconditional exact test for the di erence of proportions for 2 2 tables.
Download A.1 SAS EXAMPLES

Information
Domain:
Source:
Link to this page:
Documents from same domain

Student Solutions Manual to accompany Applied …
users.stat.ufl.eduPREFACE This Student Solutions Manual gives intermediate and final numerical results for all starred (*) end-of-chapter Problems with computational elements contained in Applied Linear Statistical Models, 5th edition.No solutions are given for Exercises, Projects, or Case
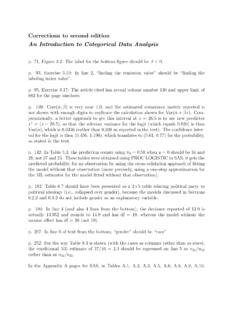
Corrections to second edition An Introduction to ...
users.stat.ufl.eduCorrections to second edition An Introduction to Categorical Data Analysis p. 71, Figure 3.2: The label for the bottom figure should be β < 0.
An Introduction to Categorical Data Analysis Using R
users.stat.ufl.eduAn Introduction to Categorical Data Analysis Using R Brett Presnell March 28, 2000. Abstract This document attempts to reproduce the examples and some of the exercises in An Introduction to Categor-ical Data Analysis [1] using the R statistical programming environment. Chapter 0

Chapters 1–3: Introduction, Two-Way Contingency Tables
users.stat.ufl.eduA.4 SPSS Chapters 1–3: Introduction, Two-Way Contingency Tables The DESCRIPTIVE STATISTICS option on the ANALYZE menu has a suboption called CROSSTABS, which provides several methods for contingency tables.
14.1 The Wilcoxon Rank Sum Test - University of Florida
users.stat.ufl.edumeasurement, for example, entitles you to remove the outlier and analyze the remaining data. If the outlier appears to be “real data,” it ... Our test statistic is the rank sum 23 for the weed-free plots. To calculate the -value ( 23), we need to know the sampling distri-
Introduction to Biostatistics
users.stat.ufl.edu6.1 Completely Randomized Design (CRD) For Parallel Groups Studies . . . . . . . . . 97 ... 8 CHAPTER 1. INTRODUCTION PO6 Positive or negative result of all pregnant women who would ever use a particular brand of home pregnancy test. Samples are observed sets of measurements that are subsets of a corresponding population.
STA 3024 Exam 3 Practice Problems NOTE: These are just ...
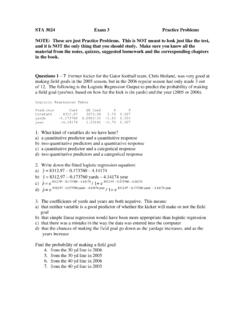
users.stat.ufl.eduSTA 3024 Exam 3 Practice Problems NOTE: These are just Practice Problems. This is NOT meant to look just like the test, and it is NOT the only thing that you should study. Make sure you know all the material from the notes, quizzes, suggested homework and the corresponding chapters in the book.

6. Significance tests - University of Florida
users.stat.ufl.eduDecisions in Tests • a-level (significance level): Pre-specified “hurdle” for which one rejects H 0 if the P-value falls below it (Typically 0.05 or 0.01) P-Value H 0 Conclusion H a Conclusion ≤.05 Reject Accept > .05 Do not Reject Do not Accept • Rejection Region: Values of the test statistic for which we reject the null hypothesis

Two-Tailed Test One-Tailed Test α
users.stat.ufl.eduCritical Values of the Wilcoxon Signed Ranks Test Two-Tailed Test One-Tailed Test n α = .05 α = .01 α = .05 α = .01 5 -- -- 0 -- 6 0 -- 2 --
Chapter 05 - Amortization and Sinking Funds
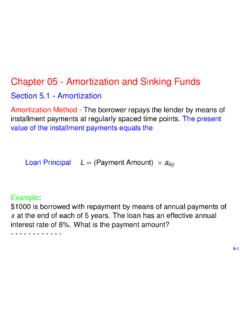
users.stat.ufl.eduSection 5.3 - Amortization Schedules Time Payment 0 1 2 .. t-1 t t+1 .. n 0 1 In the same setting as in the previous section, n total payments of 1 repay a loan of a nj. We now examine in greater detail the tth payment. 5-8
Related documents

Big data in R - Columbia University
www.columbia.edustart_time <- proc.time() <call> proc.time() – start_time Image from : • Note: with option 2, you need to send all three commands to R at once ... •Use logistic regression to model high_price as a function of color, cut, depth, and clarity. Use system.time to see how
The PROBIT Procedure
www.math.wpi.eduNotice that PROC PROBIT, by default, models the probability of the lower response levels. The choice of the distribution function F (normal for the probit model, logistic for the logit model, and extreme value or Gompertz for the gompit model) determines the type of analysis. For most problems, there is relatively little difference between

Item Response Theory: What It Is and How You Can Use the ...
support.sas.comconstrained to be equal. In the case where the logistic link is used, the one- and two-parameter models are often abbreviated as 1PL and 2PL, respectively. When all the slope parameters are set to 1 and the factor variance is set to a free parameter, you obtain the Rasch model.

165-29: Performing a 1:N Case-Control Match on Propensity ...
support.sas.comBelow is the SAS PROC LOGISTIC code for the multivariate logistic regression that was run to compute the propensity scores; one score per patient. In this example, the propensity score is the predicted probability of having the treatment (revasc). The propensity score is saved in the file study.AllPropen. Hx COPD Chest Pain Mean Mean 4,416.3990
Using and Understanding LSMEANS and LSMESTIMATE
lexjansen.comusing the STORE statement and PROC PLM to test hypotheses without having to redo all the model calculations. This material is appropriate for all levels of SAS experience, but some familiarity with linear models is assumed. INTRODUCTION . In a linear model, some of the predictors may be continuous and some may be discrete. A continuous predictor is