
A.1 SAS EXAMPLES
PROC FREQ forms the table with the TABLES statement, ordering row and column categories alphanumerically. To use instead the order in which the categories appear in the data set (e.g., to treat the variable properly in an ordinal anal-ysis), use the ORDER = DATA option in the PROC statement. The WEIGHT state-
Download A.1 SAS EXAMPLES

Information
Domain:
Source:
Link to this page:
Documents from same domain

Student Solutions Manual to accompany Applied …
users.stat.ufl.eduPREFACE This Student Solutions Manual gives intermediate and final numerical results for all starred (*) end-of-chapter Problems with computational elements contained in Applied Linear Statistical Models, 5th edition.No solutions are given for Exercises, Projects, or Case
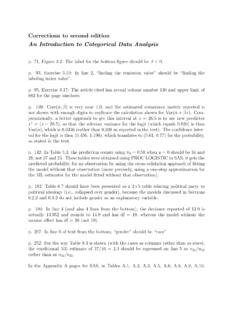
Corrections to second edition An Introduction to ...
users.stat.ufl.eduCorrections to second edition An Introduction to Categorical Data Analysis p. 71, Figure 3.2: The label for the bottom figure should be β < 0.
An Introduction to Categorical Data Analysis Using R
users.stat.ufl.eduAn Introduction to Categorical Data Analysis Using R Brett Presnell March 28, 2000. Abstract This document attempts to reproduce the examples and some of the exercises in An Introduction to Categor-ical Data Analysis [1] using the R statistical programming environment. Chapter 0

Chapters 1–3: Introduction, Two-Way Contingency Tables
users.stat.ufl.eduA.4 SPSS Chapters 1–3: Introduction, Two-Way Contingency Tables The DESCRIPTIVE STATISTICS option on the ANALYZE menu has a suboption called CROSSTABS, which provides several methods for contingency tables.

14.1 The Wilcoxon Rank Sum Test - University of Florida
users.stat.ufl.edumeasurement, for example, entitles you to remove the outlier and analyze the remaining data. If the outlier appears to be “real data,” it ... Our test statistic is the rank sum 23 for the weed-free plots. To calculate the -value ( 23), we need to know the sampling distri-
Introduction to Biostatistics
users.stat.ufl.edu6.1 Completely Randomized Design (CRD) For Parallel Groups Studies . . . . . . . . . 97 ... 8 CHAPTER 1. INTRODUCTION PO6 Positive or negative result of all pregnant women who would ever use a particular brand of home pregnancy test. Samples are observed sets of measurements that are subsets of a corresponding population.
STA 3024 Exam 3 Practice Problems NOTE: These are just ...
users.stat.ufl.eduSTA 3024 Exam 3 Practice Problems NOTE: These are just Practice Problems. This is NOT meant to look just like the test, and it is NOT the only thing that you should study. Make sure you know all the material from the notes, quizzes, suggested homework and the corresponding chapters in the book.

6. Significance tests - University of Florida
users.stat.ufl.eduDecisions in Tests • a-level (significance level): Pre-specified “hurdle” for which one rejects H 0 if the P-value falls below it (Typically 0.05 or 0.01) P-Value H 0 Conclusion H a Conclusion ≤.05 Reject Accept > .05 Do not Reject Do not Accept • Rejection Region: Values of the test statistic for which we reject the null hypothesis

Two-Tailed Test One-Tailed Test α
users.stat.ufl.eduCritical Values of the Wilcoxon Signed Ranks Test Two-Tailed Test One-Tailed Test n α = .05 α = .01 α = .05 α = .01 5 -- -- 0 -- 6 0 -- 2 --
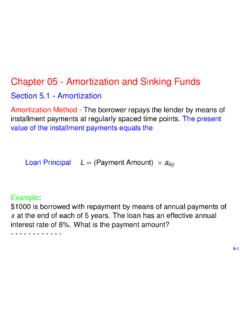
Chapter 05 - Amortization and Sinking Funds
users.stat.ufl.eduSection 5.3 - Amortization Schedules Time Payment 0 1 2 .. t-1 t t+1 .. n 0 1 In the same setting as in the previous section, n total payments of 1 repay a loan of a nj. We now examine in greater detail the tth payment. 5-8
Related documents

The SURVEYSELECT Procedure
www.math.wpi.eduThe random number seed is 39647. PROC SURVEYSELECTuses this number as the initial seed for random number generation. Since the SEED= option is not specified in the PROC SURVEYSELECT statement, the seed value is obtained using the time of day from the computer’s clock. You can specify SEED=39647 to reproduce this sample. Customer Satisfaction ...

The FREQ Procedure - SAS
support.sas.comPROC FREQ uses the Output Delivery System (ODS), a SAS subsystem that provides capabilities for displaying and controlling the output from SAS procedures. ODS enables you to convert any of the output from PROC FREQ into a SAS data set. See the section “ODS Table Names” on page 2773 for more

Basics of Proc Tabulate - SAS: Analytics, Artificial ...
www.sas.comproc means data=sashelp.class; var age height; run; proc means data=sashelp.class; class sex; var age height; run; “I want summary stats on students’ ages and heights, overall and by gender.”

SUGI 27: PROC FORMAT in Action - SAS Support
support.sas.comthe “code” in the application – the PROC FREQ in our simple example – from the “data” – that is, the input data set and translation data which de-references the coded values of sex. For example, we can easily modify our initial definition of SEX. to include a translation

Identifying Duplicate Values
www.lexjansen.comPROC FREQ may produce voluminous output, however, depending on the number of IDs. Output the frequency counts to a SAS data set, and run PROC FREQ on the Frequency variable to summarize duplicates: proc freq data=test noprint; tables id/out=freqs; run; The NOPRINT option on the PROC FREQ statement suppresses printed output.

線形モデルにおける - SAS
www.sas.comorder=data|formated|freq|internal •data:データセットに出力した順 •formatted:format順(デフォルト) •freq:数が多い順 •internal:フォーマットされていない値順 descending •降順にする 基準値の設定 param=effect ref=‘label’|first|last