
Answer Key - Esri
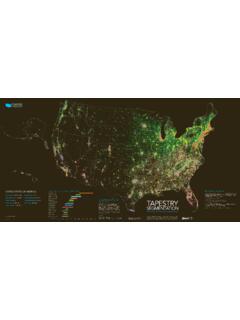
visualizations. Activity 2-2: Predominant Mapping US county crops 2007: What is dominant in the Midwest and why? Corn, wheat, and soybean are dominant in the Midwest. Why does the West Coast have a majority of vegetable production?
Download Answer Key - Esri

Information
Domain:
Source:
Link to this page:
Documents from same domain
ArcGIS 10.4 Issues Addressed List - Esri
downloads.esri.comEnterprise Geodatabase . Support Files ArcGIS Desktop Top BUG-000081094 Enable parcel division equal area to use 1 for the number of parts. BUG-000081260
ArcGIS Data Models: Water Utilities - Esri Support …
downloads.esri.comWater Utilities ArcGIS ™ Data Models Water Utilities $50.00 88053 DOME2M12/01sp Printed in USA ArcGIS ™ Water Utilities Data Model ESRI • 380 New York Street • Redlands, CA 92373-8100 • USA

D.A.R.T. (Customer Segmentation) Introduction - Esri
downloads.esri.comD.A.R.T. (Customer Segmentation) Introduction . DART is a marketing platform created by OPENmate. The life style of urban and suburb are different.

Arc Hydro Tools 2.0 - Tutorial - Esri
downloads.esri.comArc Hydro Tools v2.0 – Tutorial October 2011 2 Set Flow Direction Drainage Boundary Definition The following tables summarize the requirements (ArcEditor/ArcInfo and Spatial Analyst) for each

ArcGIS Secure Mobile Implementation Patterns - Esri
downloads.esri.comArcGIS Secure Mobile Implementation Patterns 3 | Page 2.2 ArcGIS Enterprise ArcGIS Enterprise is the software offering from Esri …
G60263 Tapestry Poster 141079 R24 dl - Esri
downloads.esri.comPrincipal Urban Centers: Young, mobile, diverse in metros of 2.5 + million people LIFEMODE SUMMARY GROUPS 1. Affl uent Estates: Established wealth —educated,
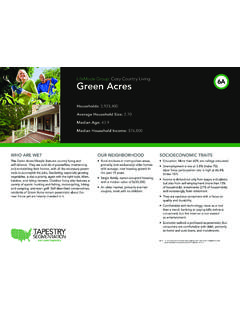
LifeMode Group: Cozy Country Living 6A Green Acres
downloads.esri.comOwn 86.1% Rent 13.9% Chart Title Own Rent Home Ownership US Percentage: 62.7% Own 37.3% Rent Population Population Growth (Annual %) Population Density (Persons per sq. mile) 350 350 350 0 0
Tutorial 9: Advanced shape grammar - Esri Support …
downloads.esri.comAttributes, variables, and assets Attributes are defined at the beginning of the rule file. These attributes are used through the entire rule set and can be modified via
Arc Hydro GP Tools 2.0 - Tutorial - Esri Support Home
downloads.esri.comBurn Stream Slope 27 ... How to create your own model 55 ... The purpose of this tutorial is to illustrate, step-by-step, how to access and use the Arc Hydro Geoprocessing (GP) tools that are installed by the standard Arc Hydro setup. The installation process

Template for Creating a Project Vision Statement
downloads.esri.comTemplate for Creating a Project Vision Statement An ESRI ... Problem Statement This section summarizes the problem being solved by this project. The following issues should be addressed: Describe the problem. Describe the stakeholders affected by the problem.
Related documents
Chapter 11 Inductance and Magnetic Energy
web.mit.eduInductance and Magnetic Energy 11.1 Mutual Inductance Suppose two coils are placed near each other, as shown in Figure 11.1.1 Figure 11.1.1 Changing current in coil 1 produces changing magnetic flux in coil 2. The first coil has N1 turns and carries a current I1 which gives rise to a magnetic field B1 G
Organization Management in Workday
www.workday.comWorkday combines org management, visualizations, and modeling with the seamless ability to execute in a single solution, empowering your organization with agility in the face of change. Download datasheet. Keywords: organization management, organization visualization, ogranization modeling, organizational agility Created Date: 7/30/2020 2:39:19 PM

Visualization/Guided Imagery - Veterans Affairs
www.mirecc.va.govVisualization/Guided Imagery (continued) Visualization/Guided Imagery Ver3.0 – July 2013 Page 2

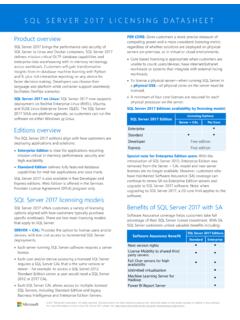
SQL SERVER 2019 LICENSING DATASHEET
download.microsoft.com• Generate data visualizations on premises with Power BI Report Server Licensing for virtualization and containers SQL Server 2019 offers use rights for virtual machines and containers, to provide flexibility for customers’ deployments. There are two primary licensing options for virtual machines and containers in SQL Server 2019 – the

Visualization Quick Guide - Domo
www.domo.comMAPS - Because of their visual appeal, maps can be effective visualizations in specific situations. When to Use Maps • To categorize regions into four or fewer groups. A U.S. map showing states in red or blue for Republican vs. Democrat is a good example. More than four groups can be difficult to interpret.
SQL SERVER 2017 LICENSING DATASHEET
download.microsoft.com• Generate data visualizations on premises with Power BI Report Server Licensing for virtualization and containers SQL Server 2017 offers use rights for virtual machines and containers, to provide flexibility for customers’ deployments. There are two primary licensing options for virtual machines and containers in SQL Server 2017 – the

STARTER GUIDE - docs.anaconda.com
docs.anaconda.comanaconda.com · info@anaconda.com · 512-776-1066 v1.18 Take Data Science to Your Organization Anaconda Enterprise extends Anaconda Distribution by enabling data science teams to build, train, and deploy models at

Army Enterprise System Integration Program (AESIP) Hub
www.eis.army.milINTEGRATED DATA SERVICES, VISUALIZATIONS, AND ANALYTIC TOOLS . MISSION. FAST FACTS. 41 Trading Partners across the DoD Enterprise. Manage over 550 complex interfaces. Responsible for: • 35 million equipment records • 22 million material records • 3.5 million vendor records • 500K customer records Army Enterprise System Integration