
Basic Pipe Stress Analysis Tutorial - sstusa.com
Step 1. Review the thermal stress contour plot first. The plot is color-coded such that “blue” region denotes areas with the least stress ratios (where stress ratio equals to actual computed stress divided by material allowable stress), “green” region …
Download Basic Pipe Stress Analysis Tutorial - sstusa.com

Information
Domain:
Source:
Link to this page:
Documents from same domain
convert Structures between PDMS and STAAD
www.sstusa.comSteps to convert Structures between PDMS and STAAD.Pro Step 1: Install “SST License Manager (SSTLM)” in the PC that is identified as a “Server” for the Translator.
Related documents
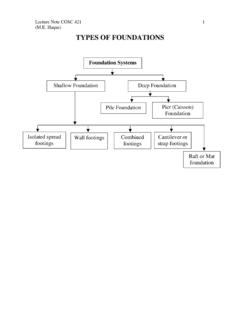
TYPES OF FOUNDATIONS
people.tamu.edutensile stress results at the left side. For p max less than allowable soil bearing capacity, no uplift is expected at the left end of the footing, and the center of gravity of the triangular bearing stress distribution coincides with the point of action of load, P. Downward Load = Area of upward triangular stress block x width P = ½ (p max) (3X)W

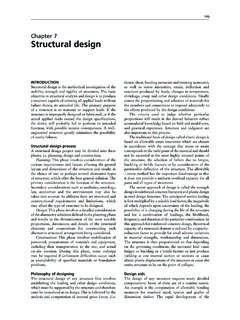
Structural Steel Design - Free
freeit.free.fr50 70-100 To 1.5 stress for A529 steel allows for savings in weight. A529 supersedes A441. A572 Grade 42 42 60 To 6 Similar to A441. Grades 60 and 65 Grade 50 50 65 To 4 not suitable for welded bridges. Grade 60 60 75 To 1.25 Grade 65 65 80 To 1.25 A242 42 63 1.5 to 5 Riveted, bolted, and 46 67 0.75 to 1.5 welded buildings and bridges.
115 - Food and Agriculture Organization
www.fao.orgChapter 7 – Structural design 117 The allowable stress in the rope is = 7.5 Therefore: Thus: 60° 30° A B P=5kN T 2 T 1 P Free body diagram T 2 = 2.5 kN T= 4.3 kN

2. Design of Welded Connections 2.1 Stresses
app.aws.orgapplicable design specifications. 2.1.2 Allowable Increase. Where the applicable design specifications permit the use of increased stresses in the base metal for any reason, a corresponding increase shall be applied to the allowable stresses given herein, but not to the stress ranges permitted for base-metal or weld metal subject to cyclic loading.

Wood Handbook--Chapter 6--Lumber Stress Grades and …
www.fpl.fs.fed.us5-min bending stress (AF&PA 1996), or (b) the allowable stress design (ASD), which is based on a design stress at the lower 5th percentile 10-year bending stress. The properties depend on the particular sorting criteria and on additional factors that are independent of the sorting criteria. Design properties are lower than the average ...

Structural Analysis by Hand - VBCOA
vbcoa.orgAllowable shear stress, F’v The maximum shear stress permissible for a specified structural member Units for stress: pounds per square inch lbs/in2 psi 47 Step 6A: Determine F’v (psi) Allowable shear stress “Raw” stress based on wood …
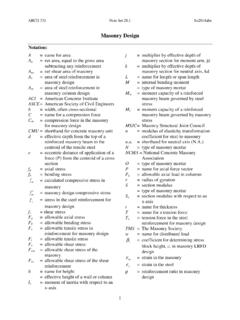
Masonry Design - Texas A&M University
faculty-legacy.arch.tamu.eduARCH 331 Note Set 28.1 Su2014abn 2 Reinforced Masonry Design Structural design standards for reinforced masonry are established by the Masonry Standards Joint Committee consisting of ACI, ASCE and The Masonry Society (TMS), and presents allowable stress design as well as limit state (strength) design.
Introduction to Railroad Track Structural Design
web.engr.uky.edu- Company design standards will dictate (e.g. Army allows a design unconfined compressive strength (q u) of 1.0 q u for "normal" traffic levels - less than 5 MGT/yr - and design of 0.8 q u when traffic levels exceed 5 MGT.) - Hay recommends factor of safety of 1.5 as applied to an ultimate bearing capacity of < 2.5 q u, thus allowable stress ...
KB-TZ2 TECHNICAL GUIDE - Hilti
www.hilti.comAllowable stress design information The load tables in this section were developed for use in NQA projects utilizing allowable stress anchorage design when appropriate per their design basis. The load values were developed based on testing per ACI 355.2 and ASTM E488. Additional information,
Micropiles Design 101 - Structural Engineers
www.sefindia.orgG allowable b D P FS L × × × = − α π AASHTO LRFD Design Table 10.5.5.2.4-1 - Resistance Factors for Geotechnical Resistance of Axially Loaded Micropiles METHOD/SOIL/CONDITION RESISTANCE FACTOR Compression Resistance of Single Micropile, φ stat Side Resistance (Bond Resistance): Presumptive Values 0.55(1) Tip Resistance on Rock O’Neill ...