Bode Plot: Example 1 - utoledo.edu
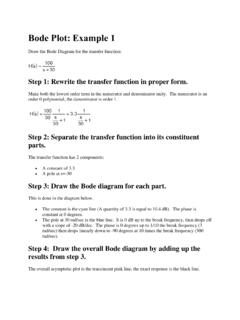
Step 3: Draw the Bode diagram for each part. This is done in the diagram below. The constant is the cyan line (A quantity of 33.3 is equal to 30 dB). The phase is constant at 0 degrees. The pole at 3 rad/sec is the green line. It is 0 dB up to the break frequency, then drops off with a slope of …
Download Bode Plot: Example 1 - utoledo.edu

Information
Domain:
Source:
Link to this page:
Documents from same domain

Intrinsic safety 101 - UToledo Engineering
www.eng.utoledo.eduIntrinsic safety 101 Protection methods, containment, segregation, and prevention ... AUTOMATION BASICS a low-voltage signaling system that was used to ... physical principles of explosion protection are the same worldwide and are not differentiated,
Chapter 19 Programming the PID Algorithm
www.eng.utoledo.eduthe power F B that the pressure P 2 ... a controller setting has to be found that supplies a sufficiently fast and stable control result over the entire working range. ... Module Configuration, 4 Channel Module Wiring, and 4 Channel Module Specifications to find the choices available for Analog Inputs and Analog Outputs.
![CHAP. 7] BLOCK DIAGRAM ALGEBRA AND TRANSFER …](/cache/preview/5/5/8/8/1/3/4/c/thumb-5588134cce7b9b85f7cd5a0611a184e9.jpg)
CHAP. 7] BLOCK DIAGRAM ALGEBRA AND TRANSFER …
www.eng.utoledo.eduBLOCK DIAGRAM ALGEBRA AND TRANSFER FUNCTIONS OF SYSTEMS 161---t o2÷o0 Step 3:-t -R GIG4 '1 -- GIG4H1 Step 4: Does not apply. Step 5: I -- GIG4111 , Gs q- G3 1 -- GIG4HI Step 6: Does not apply. € An occasional requirement of block diagram reduction is the isolation of a particular block in a feedback or feedforward loop.
Chapter 7 TIMERS, COUNTERS and T/C APPLICATIONS
www.eng.utoledo.eduspecify whether the IEC timer is stored in its own data block (single instance) or as a local tag (multiple instance) in the block interface. ... P T P T Th e s e fig u re s s h o w p u ls e d ia g ra m s o f th e G e n e ra te O ff-De la y in s tru c tio n : Fig. 7-8 Off-Delay Timer Timing Diagrams . Ch 7 Timers, Counters, T/C Applications 8 ...

Chapter 15 HUMAN MACHINE INTERFACE - utoledo.edu
www.eng.utoledo.eduThe A-B product uses RSLinx Enterprise. This means that RSLinx Enterprise has the ability to allow this software package to browse directly for the tag database and link existing tags and not requiring a tag created in the HMI to complement the tag in the PLC. When starting a new application, select Objects from the main menu. Notice the types ...
CHAP. 7] BLOCK DIAGRAM ALGEBRA AND TRANSFER …
www.eng.utoledo.eduAlso, the transfer function of a single block is its output-to-input transform'. Hence (b) (c) This system has the same transfer function determined in part (a) because multiplication of transfer functions is commutative. By Equation (7..1), we have _,0 ,4 7.4. The transfer function of Fig. 7-14a is %/(s + too), whe.re too = 1/RC. Is the ...
Chapter 15 HUMAN MACHINE INTERFACE - eng.utoledo.edu
www.eng.utoledo.eduCh 15 Human Machine Interface 4 Fig. 15-7 A handheld thermocouple readout device with paper recording output Fig. 15-8 Several discrete controller devices for process control. Each device is capable of solving a single or multiple loops of process data executing a PID formula and controlling the output of the control loop.

Studio 5000 View Designer User Manual
www.eng.utoledo.eduWhat is the Alarm Manager? on page 105 In Alarm Manager updated the wording in the tip. Work with screenson page . 107 Updated maximum numbers of screens and popups for PanelView devices. Screen tab on . page 107 Create a screen on . page 108 Change the background color of a popup on . page 110 Updated steps in the task. Rename a screen
Chapter 19 Programming the PID Algorithm - utoledo.edu
www.eng.utoledo.educontrollers. However, as PLC prices continued to fall during the 1980’s and later and more ... SLC PID block followed by the CompactLogix processor as well as the Siemens 1200 and their ... Module Configuration, 4 Channel Module Wiring, and 4 Channel Module Specifications to find the choices available for Analog Inputs and Analog Outputs.
Bode Plot: Example 1 - utoledo.edu
www.eng.utoledo.eduStep 1: Rewrite the transfer function in proper form. Make both the lowest order term in the numerator and denominator unity. The numerator is an order 1 polynomial, the denominator is order 2. Step 2: Separate the transfer function into its constituent parts. The transfer function has 4 components: A constant of 0.1 A pole at s=-10
Related documents
Ellingham - Massachusetts Institute of Technology
web.mit.eduslope of the line changes when any of the materials involved melt or vaporize. Free energy of formation is negative for most metal oxides, and so the diagram is drawn with ∆G=0 at the top of the diagram, and the values of ∆G shown are all negative numbers. Temperatures where either the metal or oxide melt or vaporize are marked on the diagram.
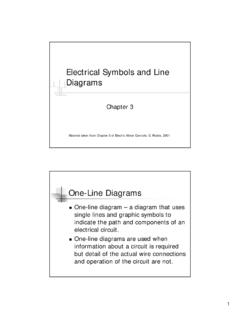
Electrical Symbols and Line Diagrams - University of Florida
abe.ufl.eduLine Diagrams A line (ladder) diagram is a diagram that shows the logic of an electrical circuit or system using standard symbols. A line diagram is used to show the relationship between circuits and their components but not the actual location of the components. Line diagrams provide a fast, easy understanding of the connections and

Example Single-Line Diagram for a SolarEdge® string ...
cms8.revize.comExample Single-Line Diagram (for an SMA® Sunny Boy string inverter system with rapid shutdown) 40A 150A #10 AWG Cu PV Wire, and a solid #6 copper EGC extending from J-box to roof racking/modules, wiring in free-air under modules meter Soladeck J-box (6) #10 AWG THWN-2 Cu, with #10 AWG Cu EGC, ¾” EMT, wiring in attic (3) #8 AWG THWN-2 Cu,
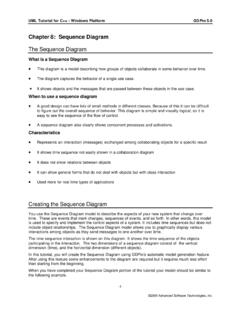
Chapter 8 : Sequence Diagram - West Virginia University
community.wvu.eduChapter 8 : Sequence Diagram The Sequence Diagram What is a Sequence Diagram This diagram is a model describing how groups of objects collaborate in some behavior over time. The diagram captures the behavior of a single use case. It shows objects and the messages that are passed between these objects in the use case. When to use a sequence diagram
Plot Diagram Name - Scholastic
www.scholastic.comPlot Diagram Climax Resolution Rising Action Events Conflict n n Name Falling Action Events Climax Exposition Story: 2016 ©Mrs. Renz‘ Class Conflict Setting (place & time) Characters. Title: ELA-Plot Diagram-byMrsRenzClass Keywords Created Date:

ZD1 Zoning Diagram - New York City
www1.nyc.govZD1 Zoning Diagram Must be typewritten. Sheet _____ of _____ Last Name First Name Middle Initial Business Name Business Telephone Business Address Business Fax City State Zip Mobile Telephone E-Mail License Number 1 Applicant Information Required for all applications.

Zoning Diagram Guide - New York City
www1.nyc.govThe diagram must be submitted on the 11X17 ZD1 form provided on the Department’s website. The items listed ... applicable, indicate a zero (0) on the appropriate line. 3 BSA and/or CPC Approvals for Subject Application If a Board of Standards & Appeals (BSA) Variance or Special Permit has been granted for the application, include