
Chapter 10: Regression and Correlation
Chapter 10: Regression and Correlation 346 The independent variable, also called the explanatory variable or predictor variable, is the x-value in the equation.The independent variable is the one that you use to predict what the other variable is. The dependent variable depends on what independent value you pick.
Download Chapter 10: Regression and Correlation

Information
Domain:
Source:
Link to this page:
Documents from same domain
Chapter 5: Discrete Probability Distributions
coconino.eduChapter 5: Discrete Probability Distributions 158 This is a probability distribution since you have the x value and the probabilities that go with it, all of the probabilities are between zero and one, and the sum of all of the probabilities is one. You can give a probability distribution in table form (as in table #5.1.1) or as a graph.
Chapter 6: Continuous Probability Distributions
coconino.eduChapter 6: Continuous Probability Distributions 193 Section 6.3: Finding Probabilities for the Normal Distribution The Empirical Rule is just an approximation and only works for certain values. What if you want to find the probability for x values that are not integer multiples of the standard deviation? The probability is the area under the curve.
Chapter 6: Graph Theory
coconino.eduLeonhard Euler first discussed and used Euler paths and circuits in 1736. Rather than finding a minimum spanning tree that visits every vertex of a graph, an Euler path or circuit can be used to find a way to visit every edge of a graph once and only once. This would be useful for checking parking meters along the streets of a city, patrolling the

Chapter 11: Chi-Square and ANOVA Tests
coconino.eduthe Chi-Square Test for Dependence, but for historical reasons it is known as the test for independence. Just as with previous hypothesis tests, all the steps are the same except for the assumptions and the test statistic. Hypothesis Test for Chi-Square Test 1. State the null and alternative hypotheses and the level of significance
Chapter 9: Apportionment - Coconino Community College
coconino.eduSection 9.1 Basic Concepts of Apportionment and Hamilton’s Method . Apportionment can be thought of as dividing a group of people (or other resources) and assigning them to different places. Example 9.1.1: Why We Need Apportionment. Tom is moving to a new apartment. On moving day, four of his friends come to
Related documents
4.8 Instrumental Variables - University of California, Davis
cameron.econ.ucdavis.eduWhat are the consequences of this correlation between x and u? Now higher levels of x have two effects on y. From (4.43) there is both a direct effect via x and an indirect effect via u effecting x which in turn effects y. The goal of regression is to estimate only the rst effect, yielding an estimate of . The OLS
Linear Mixed-Effects Regression - University of Minnesota
users.stat.umn.eduY is the correlation between any two repeated measurements from the same subject.!is referred to as theintra-class correlation coefficient (ICC). Nathaniel E. Helwig (U of Minnesota) Linear Mixed-Effects Regression Updated 04-Jan-2017 : Slide 16
LECTURE NOTES #6: Correlation and Regression
www-personal.umich.eduLecture Notes #6: Correlation and Regression 6-5 The covariance is similar to the variance except that it is defined over two variables (X and Y) rather than one (Y). We begin with the numerator of the covariance—it is the “sums of squares” of the two variables. Sxy = X (X −X)(Y −Y) (6-4) The (estimated) covariance is Sxy N −1 (6-5)

Chapter 1 Simple Linear Regression (part 4)
web.njit.eduChapter 1 Simple Linear Regression (part 4) 1 Analysis of Variance (ANOVA) approach to regression analysis Recall the model again Yi = ... 4. β1 = 0 only indicates the correlation relationship, but not a cause-and-effect relation (causality). 5.
Chapter 15 Mixed Models - Carnegie Mellon University
www.stat.cmu.edusituations, because it allows a wide variety of correlation patterns (or variance-covariance structures) to be explicitly modeled. As mentioned in chapter14, multiple measurements per subject generally result in the correlated errors that are explicitly forbidden by the assumptions of standard (between-subjects) AN(C)OVA and regression models.
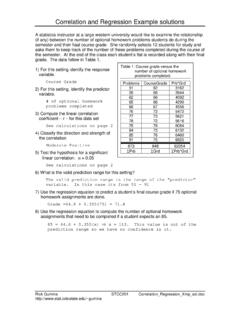
Correlation and Regression Example solutions
www.stat.colostate.edu3) Compute the linear correlation coefficient – r – for this data set See calculations on page 2 4) Classify the direction and strength of the correlation Moderate Positive 5) Test the hypothesis for a significant linear correlation. α = 0.05 See calculations on page 2 6) What is the valid prediction range for this setting?