Transcription of Chapter 10: Regression and Correlation
1 Chapter 10: Regression and Correlation 343 Chapter 10: Regression and Correlation The previous Chapter looked at comparing populations to see if there is a difference between the two. That involved two random variables that are similar measures. This Chapter will look at two random variables that are not similar measures, and see if there is a relationship between the two variables. To do this, you look at Regression , which finds the linear relationship, and Correlation , which measures the strength of a linear relationship. Please note: there are many other types of relationships besides linear that can be found for the data. This book will only explore linear, but realize that there are other relationships that can be used to describe data. Section : Regression When comparing two different variables, two questions come to mind: Is there a relationship between two variables?
2 And How strong is that relationship? These questions can be answered using Regression and Correlation . Regression answers whether there is a relationship (again this book will explore linear only) and Correlation answers how strong the linear relationship is. To introduce both of these concepts, it is easier to look at a set of data. Example # : Determining If There Is a Relationship Is there a relationship between the alcohol content and the number of calories in 12-ounce beer? To determine if there is one a random sample was taken of beer s alcohol content and calories ("Calories in beer,," 2011), and the data is in table # Table # : Alcohol and Calorie Content in Beer Brand Brewery Alcohol Content Calories in 12 oz Big Sky Scape Goat Pale Ale Big Sky Brewing 163 Sierra Nevada Harvest Ale Sierra Nevada 215 Steel Reserve MillerCoors 222 O'Doul's Anheuser Busch 70 Coors Light MillerCoors 104 Genesee Cream Ale High Falls Brewing 162 Sierra Nevada Summerfest Beer Sierra Nevada 158 Michelob Beer Anheuser Busch 155 Flying Dog Doggie Style Flying Dog Brewery 158 Big Sky Big Sky Brewing 195 Solution: To aid in figuring out if there is a relationship, it helps to draw a scatter plot of the data.
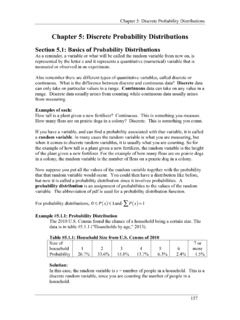
3 It is helpful to state the random variables, and since in an algebra class the Chapter 10: Regression and Correlation 344 variables are represented as x and y, those labels will be used here. It helps to state which variable is x and which is y. State random variables x = alcohol content in the beer y = calories in 12 ounce beer Figure # : Scatter Plot of Beer Data This scatter plot looks fairly linear. However, notice that there is one beer in the list that is actually considered a non-alcoholic beer. That value is probably an outlier since it is a non-alcoholic beer. The rest of the analysis will not include O Doul s. You cannot just remove data points, but in this case it makes more sense to, since all the other beers have a fairly large alcohol content. To find the equation for the linear relationship, the process of Regression is used to find the line that best fits the data (sometimes called the best fitting line).
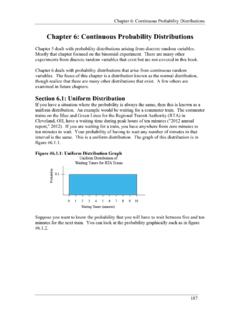
4 The process is to draw the line through the data and then find the distances from a point to the line, which are called the residuals. The Regression line is the line that makes the square of the residuals as small as possible, so the Regression line is also sometimes called the least squares line. The Regression line and the residuals are displayed in figure # 2468050100150200250 Calories vs Alcohol ContentAlcohol Content (%)Calories in 12 in BeerChapter 10: Regression and Correlation 345 Figure # : Scatter Plot of Beer Data with Regression Line and Residuals The find the Regression equation (also known as best fitting line or least squares line) Given a collection of paired sample data, the Regression equation is y=a+bx where the slope = b=SSxySSx and y-intercept = a=y bx The residuals are the difference between the actual values and the estimated values.
5 Residual=y y SS stands for sum of squares. So you are summing up squares. With the subscript xy, you aren t really summing squares, but you can think of it that way in a weird sense. SSxy=x x()y y() SSx=x x() 2 SSy=y y()2 Note: the easiest way to find the Regression equation is to use the technology. Chapter 10: Regression and Correlation 346 The independent variable, also called the explanatory variable or predictor variable, is the x-value in the equation. The independent variable is the one that you use to predict what the other variable is. The dependent variable depends on what independent value you pick. It also responds to the explanatory variable and is sometimes called the response variable. In the alcohol content and calorie example, it makes slightly more sense to say that you would use the alcohol content on a beer to predict the number of calories in the beer.
6 The population equation looks like: y= o+ 1x o=slope 1=y-intercept y is used to predict y. Assumptions of the Regression line: a. The set (x,y) of ordered pairs is a random sample from the population of all such possible x,y() pairs. b. For each fixed value of x, the y-values have a normal distribution. All of the y distributions have the same variance, and for a given x-value, the distribution of y-values has a mean that lies on the least squares line. You also assume that for a fixed y, each x has its own normal distribution. This is difficult to figure out, so you can use the following to determine if you have a normal distribution. i. Look to see if the scatter plot has a linear pattern. ii. Examine the residuals to see if there is randomness in the residuals. If there is a pattern to the residuals, then there is an issue in the data.
7 Example # : Find the Equation of the Regression Line a.) Is there a positive relationship between the alcohol content and the number of calories in 12-ounce beer? To determine if there is a positive linear relationship, a random sample was taken of beer s alcohol content and calories for several different beers ("Calories in beer,," 2011), and the data are in table # Chapter 10: Regression and Correlation 347 Table # : Alcohol and Calorie Content in Beer without Outlier Brand Brewery Alcohol Content Calories in 12 oz Big Sky Scape Goat Pale Ale Big Sky Brewing 163 Sierra Nevada Harvest Ale Sierra Nevada 215 Steel Reserve MillerCoors 222 Coors Light MillerCoors 104 Genesee Cream Ale High Falls Brewing 162 Sierra Nevada Summerfest Beer Sierra Nevada 158 Michelob Beer Anheuser Busch 155 Flying Dog Doggie Style Flying Dog Brewery 158 Big Sky Big Sky Brewing 195 Solution.
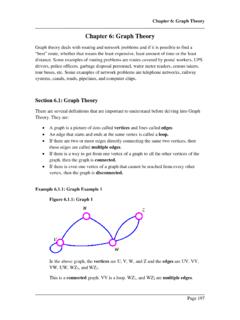
8 State random variables x = alcohol content in the beer y = calories in 12 ounce beer Assumptions check: a. A random sample was taken as stated in the problem. b. The distribution for each calorie value is normally distributed for every value of alcohol content in the beer. i. From Example # , the scatter plot looks fairly linear. ii. The residual versus the x-values plot looks fairly random. (See figure # ) It appears that the distribution for calories is a normal distribution. To find the Regression equation on the TI-83/84 calculator, put the x s in L1 and the y s in L2. Then go to STAT, over to TESTS, and choose LinRegTTest. The setup is in figure # The reason that >0 was chosen is because the question was asked if there was a positive relationship. If you are asked if there is a negative relationship, then pick <0.
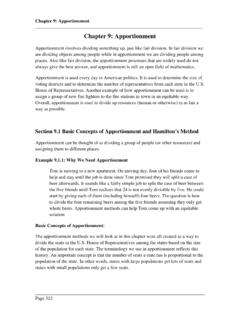
9 If you are just asked if there is a relationship, then pick 0. Right now the choice will not make a different, but it will be important later. Figure # : Setup for Linear Regression Test on TI-83/84 Chapter 10: Regression and Correlation 348 Figure # : Results for Linear Regression Test on TI-83/84 From this you can see that y= + To find the Regression equation using R, the command is lm(dependent variable ~ independent variable), where ~ is the tilde symbol located on the upper left of most keyboards. So for this example, the command would be lm(calories ~ alcohol), and the output would be Call: lm(formula = calories ~ alcohol) Coefficients: (Intercept) alcohol From this you can see that the y-intercept is and the slope is So the Regression equation is y= + Remember, this is an estimate for the true Regression .
10 A different random sample would produce a different estimate. Chapter 10: Regression and Correlation 349 b.) Use the Regression equation to find the number of calories when the alcohol content is Solution: xo= y= + ()=196 calories If you are drinking a beer that is alcohol content, then it is probably close to 196 calories. Notice, the mean number of calories is 170 calories. This value of 196 seems like a better estimate than the mean when looking at the original data. The Regression equation is a better estimate than just the mean. c.) Use the Regression equation to find the number of calories when the alcohol content is Solution: xo= y= + ()=78 calories If you are drinking a beer that is alcohol content, then it has probably close to 78 calories. This doesn t seem like a very good estimate.