Chapter 13: Analyzing Differences Between Groups
1. Multivariate analysis: statistical procedures, which examine three or more independent variables and/or two or more dependent variables at the same time. 2. Figure 13.7 explains the purpose of some of these advanced difference analyses and illustrates how each has been used to study communication behavior. IV. Conclusion A.
Download Chapter 13: Analyzing Differences Between Groups

Information
Domain:
Source:
Link to this page:
Documents from same domain
Final Exam - George Mason University
mason.gmu.eduFinal Exam 1. What is the ... analyzes these numbers using statistics, ... pilot participants from the final sample for the study. Response rate: ...
Practical Meta-Analysis Analysis Exercise using SPSS
mason.gmu.eduPractical Meta-Analysis Analysis Exercise using SPSS Analysis Exercise – July 22-23, 2005 Page 1 Practical Meta-Analysis

Research Proposal Special Education Process-Mona
mason.gmu.eduResearch Proposal-Special Education Process 3 identity. The ultimate goal of this project is to shed light on how the dominate cultural norms and

BALTIMORE CITY PUBLIC SCHOOLS - George Mason University
mason.gmu.eduHISTORY-1800’S1826-General School Law allowed the Mayor of Baltimore & City Council to create Board of Commissioners of Public Schools-to establish and regulate a
Chapter 9: Textual Analysis - George Mason University
mason.gmu.eduChapter 9: Textual Analysis I. Introduction A. Textual analysis is the method communication researchers use to describe and interpret the characteristics of a recorded or visual message. 1. The purpose of textual analysis is to describe the content, structure, and functions of the
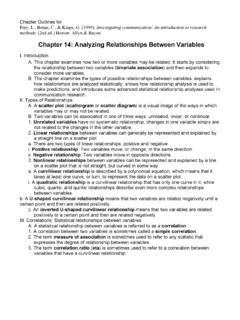
Chapter 14: Analyzing Relationships Between Variables
mason.gmu.edu1. The regression line (line of best fit) is denoted by a straight line through the data on a scatter plot. 2. Regression analysis is accomplished by constructing a regression equation (also called a prediction equation or regression model), which is an algebraic equation …

Spectrometric Identification of Organic Compounds
mason.gmu.edumentally into a molecule, or give a qualitative interpretation of a spectrum taken on a known compound, or have a computer do these things instead.

Chemistry 817 Organic Structural Spectroscopy Fall 2018 Dr ...
mason.gmu.eduChemistry 817 covers the spectroscopic determination of organic molecular structure using dispersive and Fourier transform infrared spectroscopy, multinuclear NMR, mass spectrometry, ultraviolet/visible spectroscopy, and Raman spectroscopy.
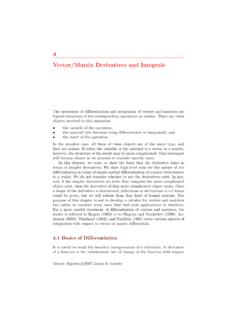
4 Vector/Matrix Derivatives and Integrals
mason.gmu.eduVector/Matrix Derivatives and Integrals ... purpose of this chapter is not to develop a calculus for vectors and matrices ... Matrix Algebra c 2007 James E. Gentle. 146 4 Vector/Matrix Derivatives and Integrals to the variable with which the differentiation is taken. If both the function

s to - mason.gmu.edu
mason.gmu.eduVol. 13, No. 1, August 2007 MatheMatics teaching in the Middle school 25 connecting MatheMatics with the art While searching for an interesting and effective way to …
Related documents

Introduction to Probability and Statistics Using R
ipsur.r-forge.r-project.orgmaterial in Chapter 2 in a class period that is supplemented by a take-home assignment for the students. I spend a lot of time on Data Description, Probability, Discrete, and Continuous Distributions. I mention selected facts from Multivariate Distributions in passing, and discuss the meaty parts of Sampling Distributions before moving right ...
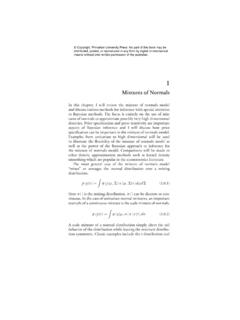
Mixtures of Normals - Princeton University
assets.press.princeton.edu4 Chapter 1-2 02468-2 0 2 4 68 Figure1.2. A Mixture of Bivariate Normals displayed in many datasets. The lower left panel of Figure 1.1 shows the mixture.5N(−1,1) +.5N(1,1), a distribution that is moreorlessuniformnearthemode.Finally,itisobviousthatwe can produce multi-modal distributions simply by allocating one

Multivariate Analysis of Variance (MANOVA)
ncss-wpengine.netdna-ssl.com2 1 f = e - 2 ph - 2 g = + − > + − − = 1 otherwise if 5 0 5 4 2 2 2 2 p h p h p h t This approximation is exact if p or h ≥ 2. Lawley - Hotelling Trace The trace statistic, T2 g, is defined as follows: 2 φ j s j=1 T g = e∑ where s = min(p,h) The following approximation based on the F-distribution is used to determine significance ...

Probability Theory: STAT310/MATH230 April15,2021
adembo.su.domains3.5. Random vectors and the multivariate clt 141 Chapter 4. Conditional expectations and probabilities 153 4.1. Conditional expectation: existence and uniqueness 153 4.2. Properties of the conditional expectation 159 4.3. The conditional expectation as an orthogonal projection 166 4.4. Regular conditional probability distributions 171 Chapter 5.

Pattern Recognition and Machine Learning
www.microsoft.combook and an unabridged version of chapter 8 on Graphical Models. This document, as well as further ... Knowledgeof multivariate calculusand basic linear algebra is required, and some familiarity with probabilities would be helpful though not es- ... 2 Probability Distributions 67