Chapter 13: Analyzing Differences Between Groups
categories of one nominal independent variable that constitute different groups of people and the categories of a nominal dependent variable. C. The Nature of Ordinal Data 1. Ordinal measurements not only categorize variables but also rank them along a dimension. 2. Most analyses of data acquired from groups measured on an ordinal dependent ...
Download Chapter 13: Analyzing Differences Between Groups

Information
Domain:
Source:
Link to this page:
Documents from same domain
Final Exam - George Mason University
mason.gmu.eduFinal Exam 1. What is the ... analyzes these numbers using statistics, ... pilot participants from the final sample for the study. Response rate: ...

Practical Meta-Analysis Analysis Exercise using SPSS
mason.gmu.eduPractical Meta-Analysis Analysis Exercise using SPSS Analysis Exercise – July 22-23, 2005 Page 1 Practical Meta-Analysis

Research Proposal Special Education Process-Mona
mason.gmu.eduResearch Proposal-Special Education Process 3 identity. The ultimate goal of this project is to shed light on how the dominate cultural norms and

BALTIMORE CITY PUBLIC SCHOOLS - George Mason University
mason.gmu.eduHISTORY-1800’S1826-General School Law allowed the Mayor of Baltimore & City Council to create Board of Commissioners of Public Schools-to establish and regulate a
Chapter 9: Textual Analysis - George Mason University
mason.gmu.eduChapter 9: Textual Analysis I. Introduction A. Textual analysis is the method communication researchers use to describe and interpret the characteristics of a recorded or visual message. 1. The purpose of textual analysis is to describe the content, structure, and functions of the
Chapter 14: Analyzing Relationships Between Variables
mason.gmu.edu1. The regression line (line of best fit) is denoted by a straight line through the data on a scatter plot. 2. Regression analysis is accomplished by constructing a regression equation (also called a prediction equation or regression model), which is an algebraic equation …

Spectrometric Identification of Organic Compounds
mason.gmu.edumentally into a molecule, or give a qualitative interpretation of a spectrum taken on a known compound, or have a computer do these things instead.

Chemistry 817 Organic Structural Spectroscopy Fall 2018 Dr ...
mason.gmu.eduChemistry 817 covers the spectroscopic determination of organic molecular structure using dispersive and Fourier transform infrared spectroscopy, multinuclear NMR, mass spectrometry, ultraviolet/visible spectroscopy, and Raman spectroscopy.
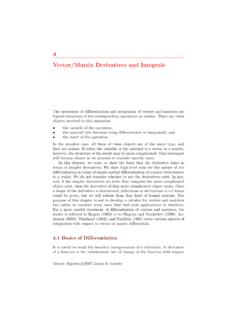
4 Vector/Matrix Derivatives and Integrals
mason.gmu.eduVector/Matrix Derivatives and Integrals ... purpose of this chapter is not to develop a calculus for vectors and matrices ... Matrix Algebra c 2007 James E. Gentle. 146 4 Vector/Matrix Derivatives and Integrals to the variable with which the differentiation is taken. If both the function

s to - mason.gmu.edu
mason.gmu.eduVol. 13, No. 1, August 2007 MatheMatics teaching in the Middle school 25 connecting MatheMatics with the art While searching for an interesting and effective way to …
Related documents
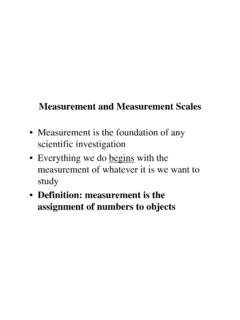
Measurement and Measurement Scales
ibg.colorado.eduOrdinal Interval Ratio • The scales are distinguished on the relationships assumed to exist between objects having different scale values ... Independent and Dependent Variables • Independent variables: manipulated by the experimenter under the control of the experimenter
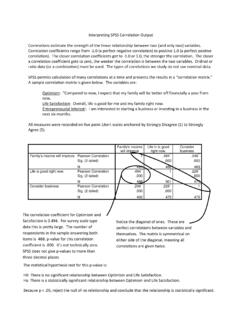
Interpreting SPSS Correlation Output
academic.udayton.eduThe dependent (Y) variable is always ordinal or ratio data while the independent (X) variable is always nominal data (or other data that’s converted to be nominal). With ANOVA, the independent variable can have as many levels as desired. A sample of SPSS ANOVA output is below and on the following page. The variables in this example are:
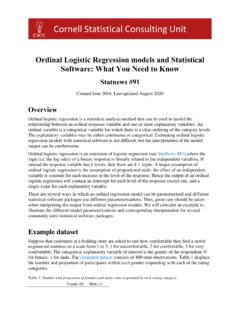
Ordinal Logistic Regression models and Statistical ...
cscu.cornell.eduEstimating ordinal logistic regression models with statistical software is not difficult, but the interpretation of the model output can be cumbersome. Ordinal logistic regression is an extension of logistic regression (see StatNews #81) where the logit (i.e. the log odds) of a binary response is linearly related to the independent variables. If
Getting Started in Logit and Ordered Logit Regression
www.princeton.eduologit: Predictions for y_ordinal. prvalue , x(x1=1) save Probabilities when x1=1 and all other independent variables are held at their mean values. Notice the save option. Probabilities when x1=2 and all other independent variables are held at their mean values. Notice the dif option.
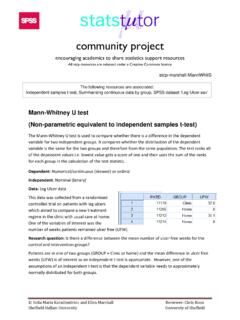
Mann-Whitney U test (Non-parametric equivalent to ...
www.sheffield.ac.ukDependent: Numerical/continuous (skewed) or ordinal . Independent: Nominal (binary) Data: Leg Ulcer data . This data was collected from a randomised controlled trial on patients with leg ulcers which aimed to compare a new treatment regime in the clinic with usual care at home. One of the variables of interest was the
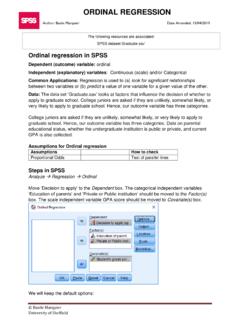
Ordinal regression in SPSS - University of Sheffield
www.sheffield.ac.ukOrdinal regression in SPSS Dependent (outcome) variable: ordinal Independent (explanatory) variables: Continuous (scale) and/or Categorical Common Applications: Regression is used to (a) look for significant relationships between two variables or (b) predict a value of one variable for a given value of the other.
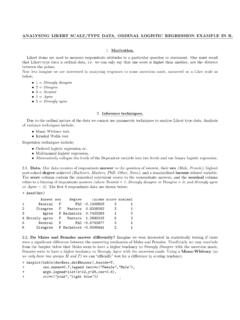
ANALYSING LIKERT SCALE/TYPE DATA, ORDINAL LOGISTIC ...
www.st-andrews.ac.ukThe Ordinal Logisic Regression Model. Ordinal logistic regression or (ordinal regression) is used to predict an ordinal dependent variable given one or more independent variables.
The Mann Whitney U: A Test for Assessing Whether Two ...
www.tqmp.org(c) The data measurement scale is of ordinal or continuous type. The observations values are then of ordinal, relative or absolute scale type. 1.3. The Test The Mann‐Whitney U test initially implies the calculation of a U statistic for each group. These statistics