
Chapter 2: Frequency Distributions and Graphs (or making ...
Frequency Polygon – a graph that displays the data by using lines that connect points plotted for the frequencies at the midpoints of the classes. The frequencies are represented by the heights of the points. Steps: 1. Find the midpoint of each class (by averaging the class boundaries). 2. Draw the x and y axes.
Download Chapter 2: Frequency Distributions and Graphs (or making ...

Information
Domain:
Source:
Link to this page:
Documents from same domain

A demo using PETSc - UC Denver
math.ucdenver.eduDistributed Kernel Finite Difference A demo using PETSc Michael McCourt mccourt@sigopt.com

SYLLABUS - MATH 3200: Elementary Differential …
math.ucdenver.eduMath 3200 – Spring 2014 Page 3 mistakes are usually discounted at half a point per mistake unless your arithmetic mistake totally trivializes the problem in which case the deduction will be severe.
MATH 4310 :: Introduction to Real Analysis I :: Spring ...
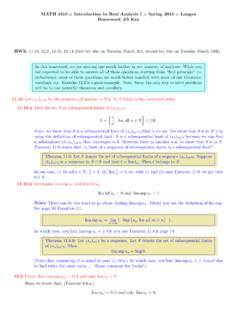
math.ucdenver.eduSo, combining 0 liminf js nj liminf js nj limsupjs nj limsupjs nj= 0 leads us to: 0 liminf js nj limsupjs nj= 0; which leads to liminf js nj= limsupjs nj= 0: By Theorem 10.7.ii, we conclude that limjs nj= 0: …

Hadamard Matrices and Designs
math.ucdenver.eduHadamard matrix are permuted, the matrix remains Hadamard. It is also true that if any row or column is multiplied by -1, the Hadamard property is retained. [Prove this] Thus, it is always possible to arrange to have the first row and first column of an Hadamard matrix contain only +1 entries. An Hadamard matrix in this form is said to be ...

Combinatorial Proofs
math.ucdenver.eduBinomial Theorem Notice that each term of the binomial expansions is a product composed of one item of each color. This suggests another way to look at this process of multiplication. Think of each factor in the product as a box containing two items, an x and a y (the colors are used here to keep track of which box an x or a y came from). We
Chapter 2: Frequency Distributions and Graphs (or making ...
math.ucdenver.eduFrequency distribution – the organization of raw data in table form, using classes and frequencies. Class – a quantitative or qualitative category. A class may be a range of numerical values (that acts like a “category”) or an actual category. Frequency – the number of data values contained in a specific class.
Finite Fields - Mathematical and Statistical Sciences
math.ucdenver.eduConstructing Finite Fields Another idea that can be used as a basis for a representation is the fact that the non-zero elements of a finite field can all be written as powers of a primitive element. Example: Let ω be a primitive element of GF(4). The elements of GF(4) are then 0, ω, ω2, ω3. Multiplication is easily done in this

Tutorial for the R Statistical Package
math.ucdenver.eduThis software can also be downloaded for free by anyone from various sites around the world. Let’s first start by downloading and installing R on your machine. After con-necting to the internet go to: www.r-project.org. From here select CRAN from the menu on the left side of the page. On the next page select a mirror from
Related documents
PRACTICE, Grade K
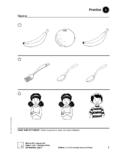
teacherlink.ed.usu.eduAt Home: Draw a picture of yourself doing something that you wish you could do. McGraw-Hill Language Arts Grade K, Unit 1, Study Skills, 4 page 6 Practice Name 4 MAKING LISTS Draw lines to show what each person at the left might be wishing for.
Visual Basic Programming - Baylor University
cs.baylor.eduH You draw pictures of your user interface. H You draw buttons, text boxes, and other user-interface items. H You add little snippets of code to handle the user interaction. H You add initialization code, usually as the last step. H If you like, you can code more complex functions. (But many do not.)

How to create a multi-level house in Sweet Home 3D
www.sweethome3d.comTo draw the first raised floor, load the Layer 0 file again. Because the first floor will consist of two blocks, you will need to save the file twice, as Layer 1a and as Layer 1b. Using the file Layer 1a delete all features in the right part of your design. Repeat the process using
A Guide to Reading and Understanding the EKG
www.columbia.eduAs an example of using the mnemonic, in the segment of the EKG below, start at the QRS that lines up with the vertical line at "0". Now counting back each vertical line to the previous EKG "300-150-100" we notice the HR to be slightly less than 100 (probably around 90-95). Figure 2 - Determining the Rate
ORBITALS and MOLECULAR REPRESENTATION
www.smallscalechemistry.colostate.eduNext we show the phase pictures of combining the sp hybrid orbitals with fi rst one and then both of the remaining p orbitals. Phase pictures. loop Diagram Axes for you to draw the loop diagram. You will also see these orbitals in greyscale, without phases. We use reddish grey for unhybridized orbitals and plain gray for for hybridized orbitals. 2s
Interpreting Childrens Human Figure Drawings
www.gwinnett.k12.ga.usMany elementary school students willingly draw pictures at the request of a school counselor or other adult. Around 10 years of age, children begin to become dissatisfied, discouraged and self-critical with their drawing attempts, probably because they are unable to draw …

Creating a Research Poster in PowerPoint
www.brown.edu• Click AutoShapes in the Drawing toolbar, point to Lines, and then click the line style you want. • Drag to draw the line. To constrain the line to draw at 15-degree angles from its starting point, hold down SHIFT as you drag. To lengthen the line in opposite directions from the first end point, hold down CTRL as you drag.

F l y e r s w r i t i n g s k i l s - World of Fun | Home
worldoffun.cambridge.orgWords to describe pictures 2 Completing sentences 3 Making sentences longer 4 Focus on a picture 5 Write about differences 6 Finish a story 7 Complete a story 8 ... Draw lines from each sentence to the people and things in the picture. Example A …