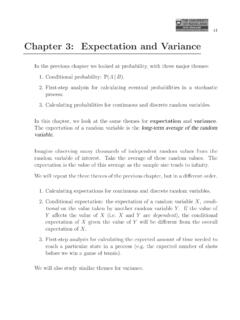
Chapter 3: Expectation and Variance
3. Calculating probabilities for continuous and discrete random variables. In this chapter, we look at the same themes for expectation and variance. The expectation of a random variable is the long-term average of the random variable. Imagine observing many thousands of independent random values from the random variable of interest.
Download Chapter 3: Expectation and Variance

Information
Domain:
Source:
Link to this page:
Documents from same domain

Computer Organisation and Architecture
www.stat.auckland.ac.nzComputer Organisation and Architecture David J. Scott Department of Statistics, University of Auckland Computer Organisation and Architecture – p.1/
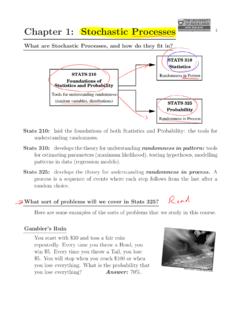
Chapter 1: Stochastic Processes - The University of …
www.stat.auckland.ac.nzChapter 1: Stochastic Processes 4 What are Stochastic Processes, and how do they fit in? STATS 310 Statistics STATS 325 Probability Randomness in Pattern

Time Series Analysis - The University of Auckland
www.stat.auckland.ac.nztime series are related in simple ways to series which are stationary. Two im- ... time spans for stationary series.) ... The theory which underlies time series analysis is quite technical in nature. In spite of this, a good deal of intuition can …
Statistics 120 Good and Bad Graphs - Department of Statistics
www.stat.auckland.ac.nzStatistics 120 Good and Bad Graphs •First •Prev •Next •Last •Go Back •Full Screen •Close •Quit The Plan • In this lecture we will try to set down some basic rules for drawing good graphs. • We will do this by showing that violating the rules produces bad graphs.

SUBJECT MATTER KNOWLEDGE FOR TEACHING
www.stat.auckland.ac.nzupon teachers’ subject matter knowledge involved in the practice of teaching. Findings regarding the knowledge required for teaching correlation coefficient are highlighted, including its computation, interpretation, sensitivity, estimation, and

The Wilcoxon Rank-Sum Test - Department of Statistics
www.stat.auckland.ac.nz1 The Wilcoxon Rank-Sum Test The Wilcoxon rank-sum test is a nonparametric alternative to the two-sample t-test which is based solely on the order in which the observations from the two samples fall. We will use the following as a running example.
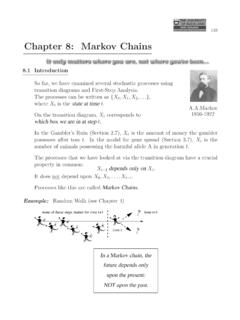
Chapter 8: Markov Chains - Auckland
www.stat.auckland.ac.nzThe matrix describing the Markov chain is called the transition matrix. It is the most important tool for analysing Markov chains. Transition Matrix list all states X t list all states z }| {X t+1 insert probabilities p ij rows add to 1 rows add to 1 The transition matrix is …
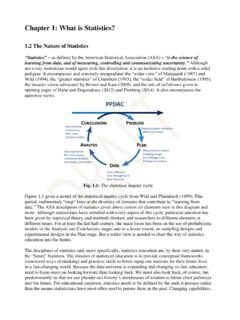
Chapter 1: What is Statistics? D - Auckland
www.stat.auckland.ac.nzChapter 1: What is Statistics? 1.2 The Nature of Statistics “Statistics” as defined by the American Statistical Association (ASA) “is the science of learning from data, and of measuring, controlling and communicating uncertainty.

Chapter 3: Expectation and Variance
www.stat.auckland.ac.nzexpectation is the value of this average as the sample size tends to infinity. We will repeat the three themes of the previous chapter, but in a different order. 1. Calculating expectations for continuous and discrete random variables. 2. Conditional expectation: the expectation of a random variable X, condi-

Chapter 4: Generating Functions - Auckland
www.stat.auckland.ac.nzThe probability generating function gets its name because the power series can be expanded and differentiated to reveal the individual probabilities. Thus, given only the PGFGX(s) = E(sX), we can recover all probabilitiesP(X = x). For shorthand, write px = P(X = x). Then GX(s) = E(sX) = X∞ x=0 pxs x = p 0+ p1s + p2s 2+p 3s 3+ p 4s 4+ ...
Related documents
Dealing with missing data: Key assumptions and methods …
www.bu.eduwith 1,000 people and 20 variables. Each of the variables has missing data on 5% of the cases, then, you could expect to have complete data for only about 360 individuals, discarding the other 640. It works well when the data are missing completely at random (MCAR), which rarely happens in reality (Nakai & Weiming, 2011). 4.1.2.

Part 2: Analysis of Relationship Between Two Variables
www.ess.uci.eduA value of 0.7654 means that 76.54% of the variance in y can be explained by the changes in X. The remaining 23.46% of the variation in y is presumed to be due to random variability. ESS210B Prof. Jin-Yi Yu Significance of the Regression Coefficients ... regression in the analysis of two variables is like the relation between the standard ...

Chapter two: Precipitation - GitHub Pages
mgebrekiros.github.ioset of data. Specifically, given a set of measurements on two random variables, y and x, regression provides a means for finding the values of the coefficients a and b for the straight line (y = a+ bx) that best fits the data. The coefficients a and b can be found using least square method using the following two equations simultaneously
UNDERSTANDING ANALYSIS OF COVARIANCE (ANCOVA)
oak.ucc.nau.edustated, whether the adjusted group means differ significantly from each other. With a one-way analysis of covariance, each individual or case must have scores on three variables: a factor or independent variable, a covariate, and a dependent variable. The factor divides individuals into two or more groups or levels, while

AP Statistics Chapter 6 Discrete, Binomial & Geometric ...
www.danshuster.comMean (expected value) of a Binomial Random Variable Formula: P np Meaning: Expected number of successes in n trials (think average) Example: Suppose you are a 80% free throw shooter. You are going to shoot 4 free throws. For n = 4, p = .8, P (4)(.8) 3.2, which means we expect 3.2 makes out of 4 shots, on average
X Y be two random variables, with means µ and Var(X ) = = …
econweb.ucsd.eduX and Y are random variables with means µ x and µ y, variances , and covariance 2 and 2 σX σY σXY, all fixed constants. Consider the new random variable U = (Y − µ Y) − b(X−µx), where b is a fixed constant that I choose. It follows that U2 = (Y − µ Y) 2 − 2b(X−µx)(Y − µ Y) + b 2(X−µ x) 2. [Hint: Do not expand this ...
Chapter 206 Two-Sample T-Test
ncss-wpengine.netdna-ssl.comThe typical comparison of two distributions is the comparison of means. If we can safely make the assumption of the data in each group following a normal distribution, we can use a two-sample t-test to compare the means of random samples drawn from these two populations. If these assumptions are severely violated, the nonparametric
Lecture: Probability Distributions
www.ssc.wisc.eduThere are two types of random variables – (1) discrete random variables – can take on finite number or infinite sequence of values (2) continous random variables – can take on any value in an interval or collection of intervals ex) The time that it takes to get to work in the morning is a continuous random variable.

graph twoway scatter — Twoway scatterplots plottypes, …
www.stata.com6graph twoway scatter— Twoway scatterplots axis choice options are for use when you have multiple x or y axes. See[G-3] axis choice options for more information.twoway options include added line options, which specify that horizontal or vertical lines be drawn on the graph; see