
CHAPTER 9 PHASE DIAGRAMS PROBLEM SOLUTIONS
9.34 Consider the hypothetical eutectic phase diagram for metals A and B, which is similar to that for the lead-tin system, Figure 9.8. Assume that (1) α and β phases exist at the A and B extremities of the phase diagram, respectively; (2) the eutectic composition is 47 wt% B-53 wt% A; and (3) the composition of the β phase at
Download CHAPTER 9 PHASE DIAGRAMS PROBLEM SOLUTIONS

Information
Domain:
Source:
Link to this page:
Documents from same domain
Why The Vasa Sank: 10 Lessons Learned
faculty.up.eduPrepared by 1 of 7 R. Fairley Why The Vasa Sank: 10 Lessons Learned Introduction Around 4:00 PM on August 10 th, 1628 the warship Vasa set sail in Stockholm harbor on its maiden voyage as the newest ship in the Royal Swedish Navy.
Examples of Data Representation - University of Portland
faculty.up.eduExamples of Data Representation using Tables, Graphs and Charts ... For example: Table 1 – costs of developing the widget. Numbers and labels go ABOVE tables but they go BELOW graphs. The top goes to the ... This is a good table. Each column has a heading and units have been included. The table
A Subsidiary of REGAL-BELOIT CORPORATION With …
faculty.up.eduLEESON Electric, has a three-generation history in electric motor manufacturing. Shown at left is a motor from the early 1900s,made by St.Louis Electrical Works, later Baldor Electric.At right is a motor from the late 1930s,made by Electro
Basic How-to create a schedule using MS Project Note: tool ...
faculty.up.eduthis is a tool to be used during the execution of the project. It should be detailed enough to communicate what tasks need to be done and when, but not “ridiculously” detailed.
CHAPTER 9 PHASE DIAGRAMS PROBLEM SOLUTIONS ε and …
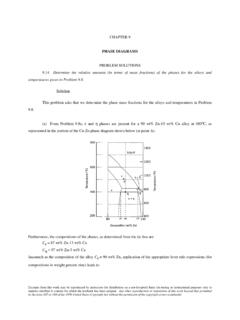
faculty.up.edu(d) From Problem 9.8d, just the α phase is present for a 30 wt% Pb-70 wt% Mg alloy at 425 °C, as may be noted in the Mg-Pb phase diagram shown below (at point D)—i.e., W α = 1.0 Excerpts from this work may be reproduced by instructors for distribution on a not-for-profit basis for testing or instructional purposes only to
Common Commands in ANSYS APDL Selecting Stuff – these ...
faculty.up.edu– Change plot settings to display element shapes using section data. o /VIEW,1,1,1,1 – Change view settings to isometric. o ... (Finite Element Model): ... use this if modeling a wooden truss with different types of beams, even though they are all the same element. ...
Stress-Strain Behavior
faculty.up.edu6.7 For a bronze alloy, the stress at which plastic deformation begins is 275 MPa (40,000 psi), and the modulus of elasticity is 115 GPa (16.7 × 10 6 psi). (a) What is the maximum load that may be applied to a specimen with a cross-sectional area of 325 mm 2 (0.5 in. 2) without plastic deformation? (b) If the original specimen length is 115 mm (4.5 in.), what is the maximum …
Section 17.4 Green’s Theorem - University of Portland
faculty.up.eduGreen’s Theorem gives us a way to transform a line integral into a double integral. To state Green’s Theorem, we need the following def-inition. Definition 1.1. We say a closed curve C has positive orientation if it is traversed counterclockwise. Otherwise we say it has a negative
Section 1.3: Valid and Invalid Arguments
faculty.up.edu3. Invalid Arguments or Fallacies To finish, we look at some typical invalid arguments. A fallacy is an errorinreasoning which leads toaninvalid argument. Thoughthere are far to many fallacies …
Section 3.1: Direct Proof and Counterexample 1
faculty.up.eduSection 3.1: Direct Proof and Counterexample 1 In this chapter, we introduce the notion of proof in mathematics. ... is rational, then x is rational”. Disprove this statement by giving a counter example. ... (ii) Start the proof by supposing that x is a particular, but arbi-trary chosen element of D for which P(x) is true.
Related documents
CHAPTER 9 PHASE DIAGRAMS PROBLEM SOLUTIONS ε and …
faculty.up.eduPHASE DIAGRAMS PROBLEM SOLUTIONS 9.14 Determine the relative amounts (in terms of mass fractions) of the phases for the alloys and temperatures given in Problem 9.8. Solution This problem asks that we determine the phase mass fractions …

Chapter Outline: Phase Diagrams
www.eng.uc.eduMSE 2090: Introduction to Materials Science Chapter 9, Phase Diagrams 3 Solvent - host or major component in solution,solute- minor component. Solubility Limitof a component in a phase is the maximum amount of the component that can be dissolved
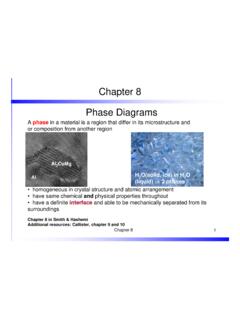
Chapter 8 Phase Diagrams - University of Western Ontario
physics.uwo.caChapter 8 2 Phase diagram and “degrees of freedom” A phase diagrams is a type of graph used to show the equilibrium conditions between the thermodynamically-distinct phases; or to show what phases are present in the material system at various T, p, and compositions

Chapter 9: Phase Diagrams - Florida International University
web.eng.fiu.eduPhase diagrams tell us about equilibrium phases as a function of T, P and composition (here, we’ll always keep P constant for simplicity). Chapter 9 - 6 Unary Systems Triple point. Chapter 9 - 7 Phase Equilibria Cu FCC 1.8 0.1278 Ni FCC 1.9 0.1246 Crystal electroneg r (nm) Structure

Phase Diagrams and Phase Separation - University of …
www.eng.uc.eduAM Donald 8 Phase Diagrams As pure components (A and B) F(c ) = F This can be lowered by going to compositions A1,B1 to give free energy F1 etc And as A and B continue to dissolve more and more of each other, free energy continues to drop. Minimum energy for homogeneous single phase, energy Fn i.e no phase separation occurs in this case.

Teach Yourself Phase Diagrams and Phase Transformations
www.grantadesign.comTeach Yourself Phase Diagrams A.2 HRS 03/11/2009 and Phase Transformations Contents Introduction and synopsis A.3 PART 1: Key terminology A.4 PART 2: Simple phase diagrams, and how to read them A.8 PART 3: The iron-carbon diagram A.20 PART 4: Interpreting more complex phase diagrams A.23

Answers to Phase Diagram Worksheet - Livingston Public …
www.livingston.orgPhase Diagram Worksheet Name: A phase diagram is a graphical way to depict the effects of pressure and temperature on the phase of a substance: The CURVES indicate the conditions of temperature and pressure under which "equilibrium" between different phases of a substance can exist. BOTH phases exist on these lines: